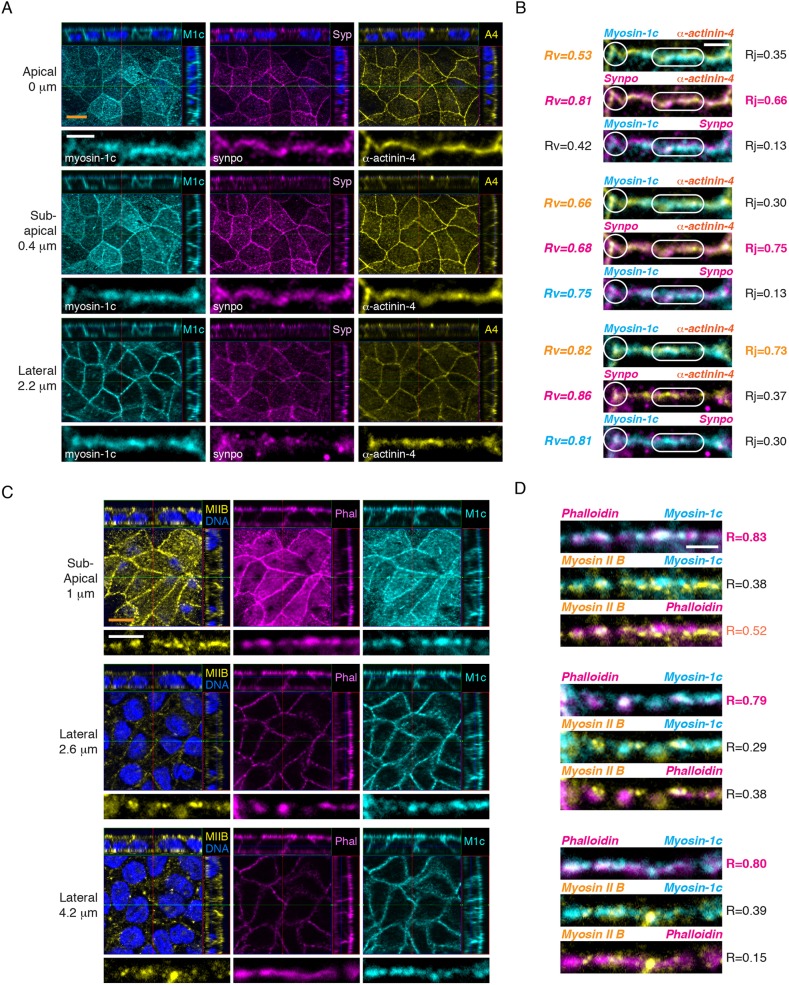
Fig. 2.
Myosin-1c colocalizes with F-actin and a tension-sensitive α-actinin-4 protein on the lateral junction in polarized epithelial monolayer. (A) OS-SIM showing immunofluorescence of myosin-1c (M1c), synaptopodin (Syp, synpo), and α-actinin-4 (A4) at the apical (z=0 µm), the sub-apical (z=0.4 µm) and the lateral (z=2.2 µm) junctions. For each z-image, the top panel shows the x-z, y-z and x-y images, and the bottom panel shows a representative linear junction from the x-y image. Data are representative of ten sets of images from one experiment out of six independent experiments. Scale bars: 10 µm (orange); 2 µm (white). (B) Merge images of the representative linear junction shown in A. The Pearson's correlation coefficients between myoin-1c, synaptopodin or α-actinin-4 at the junctional vertices (white circle) and linear junctions (white lozenge) are represented by Rv and Rj, respectively. Correlations were calculated from 500–1500 pixels per protein per z-image in one set of data. Six sets of data were analyzed and a representative set of data is shown. Scale bar: 2 µm. (C) OS-SIM showing immunofluorescence of myosin-1c, actin (phalloidin, Phal), and myosin IIB (MIIB) at the sub-apical (z=1 µm) and the lateral (z=2.6 and 4.2 µm) junctions. For each z-image, the top panel shows the x-z, y-z and x-y images, and the bottom panel shows a representative linear junction from the x-y image. Data are representative of ten sets of images from one experiment out of three independent experiments. Scale bars: 10 µm (orange); 2 µm (white). (D) Merge images of the representative linear junction shown in C. The Pearson's correlation coefficient (R) between two proteins at the linear junction was calculated from 1000–2000 pixels per protein per z-image for one set of data. Data set is representative of six sets of data from one experiment out of three independent experiments. Scale bar: 2 µm.

