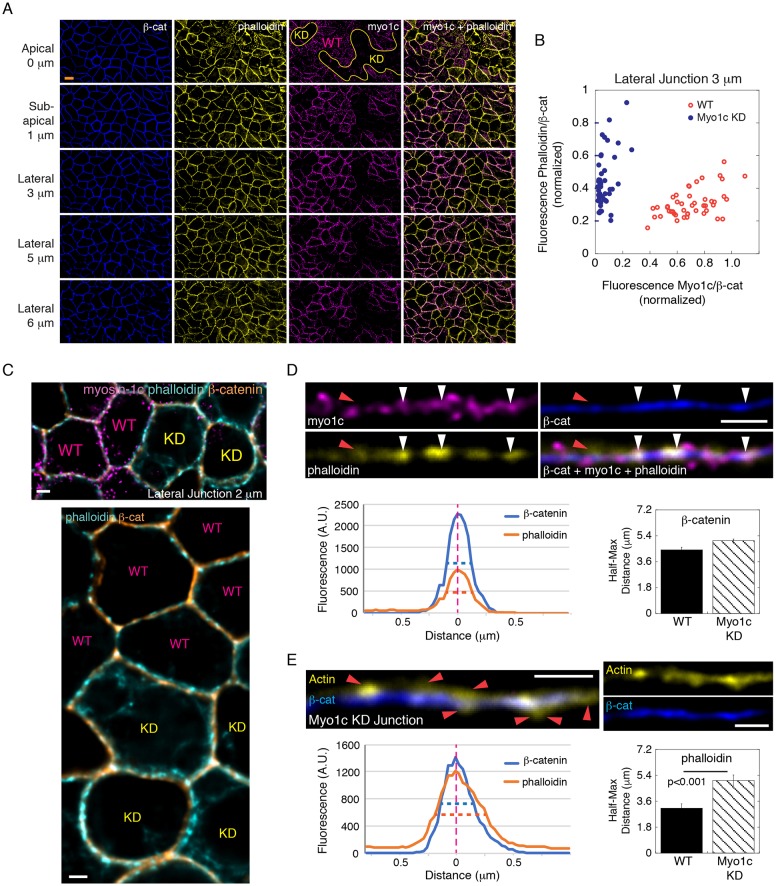
Fig. 3.
Myosin-1c knockdown disrupts actin compaction on the lateral cell-cell interface. (A) Constrained iterative deconvolution microscopy showing immunofluorescence of myosin-1c (myo1c), actin (phalloidin) and β-catenin (β-cat) at apical (z=0 µm), sub-apical (z=1 µm) and lateral (z=3, 5 and 5 µm) junctions. Images were generated from 0.2 µm wide-field optical sections. Wild-type and myosin-1c knockdown cell areas are marked by WT and KD, respectively. Data are representative of ten sets of images from one experiment out of three different experiments. Scale bar: 10 µm. (B) Junctional myosin-1c and actin (phalloidin) normalized to that of β-catenin in wild-type and myosin-1c-knockdown cells. Each point represents the measurement of one junctional area at z=3 µm. Data are representative of ten sets of images from one experiment out of three independent experiments. (C) Constrained iterative deconvolution microscopy showing immunofluorescence of myosin-1c, actin (phalloidin) and β-catenin at the lateral junction (z=2 µm). The top panel is a merge image of actin (phalloidin), β-catenin and myosin-1c. The bottom image shows the same area with actin (phalloidin) and β-catenin. Wild-type and myosin-1c-knockdown cells are marked by WT and KD, respectively. Scale bars: 2 µm. (D) Actin associates with β-catenin in the presence of myosin-1c. Immunofluorescence of actin (phalloidin), myosin-1c (myo1c) and β-catenin (β-cat) at the lateral junction (z=2 µm). White arrowheads mark regions with overlapping actin (phalloidin), myosin-1c and β-catenin. Red arrowheads mark regions with actin dissociated from β-catenin in the absence of myosin-1c. Line graphs show intensities of actin (phalloidin) and β-catenin across the lateral junctions (A.U., arbitrary units). The bar graph shows the mean±s.e.m. of the half-maximal width of β-catenin across 12 junctions in wild-type (WT) and myosin-1c knockdown (Myo1c KD) cells. Scale bar: 2 µm. (E) Actin dissociates from β-catenin at the lateral junction (z=2 µm) in myosin-1c-knockdown cells. Immunofluorescence of actin (phalloidin) and β-catenin at the lateral junction (z=2 µm) of myosin-1c-knockdown cells. Red arrowheads mark the junctional region with actin dissociated from β-catenin. Line graphs show intensities of actin (phalloidin) and β-catenin across the lateral junctions. The bar graphs shows the mean±s.e.m. of the half-maximal width of actin (phalloidin) across 12 junctions in wild-type (WT) and myosin-1c-knockdown cells. P<0.001 for phalloidin between WT and myosin KD junctions. Data are representative of 10 sets of images from one experiment out of three independent experiments. Scale bar: 2 µm.

