Fig. 5.
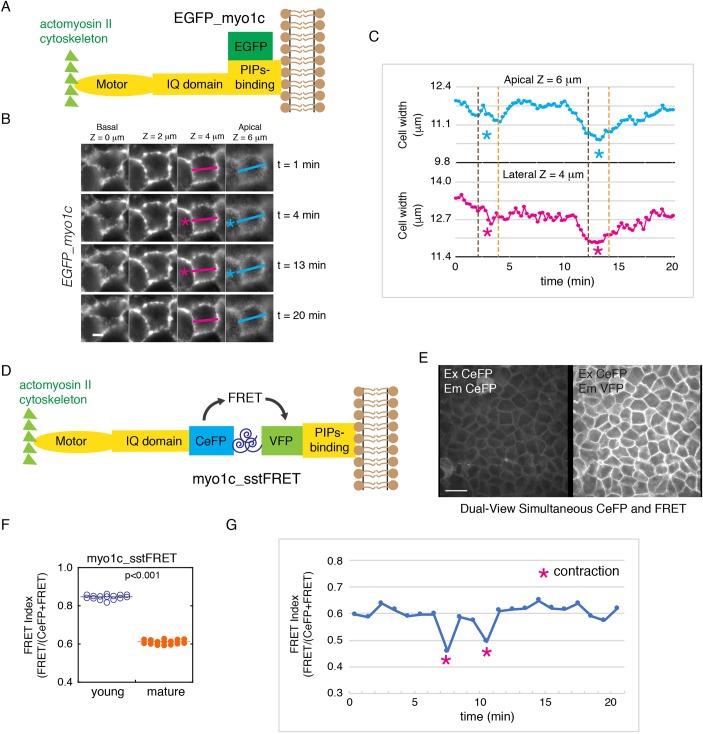
The myosin-1c force sensor reveals that there is an increase in myosin-1c tension during junction maturation and cell contraction. (A) A diagram showing the regions of EGFP–myosin-1c (EGFP_myo1c), which contains an actin-binding motor, an IQ domain, and a phosphatidylinositol-binding (PIPs-binding) domain attached to EGFP at the C-terminus. (B) Time-lapse frames showing EGFP–myosin-1c along the entire lateral cell–cell interface (from apical z=6 µm to basal z=0 µm) during whole-cell contractions (pink and blue asterisks). Data are representative of eight sets of live-cell time-lapse movies. Scale bar: 5 µm. (C) Measurements of cell width on the apical (z=6 µm) and lateral (z=4 µm) junction (marked by pink and blue lines in B) showing inwards movement of the lateral membrane during whole-cell contraction. Data are representative of eight sets of live-cell time-lapse movies. (D) Construction of a new myosin-1c tension sensor (myo1c_sstFRET) by inserting a tension sensor module (spectrin repeat flanked by CeFP and VFP) between the IQ-containing and the phosphatidylinositol-binding domains of myosin-1c. (E) Dual-view live-cell image of CeFP (excitation CeFP, emission CeFP) and FRET (excitation CeFP, emission VFP) of myo1c_sstFRET showing localization on the lateral cell-cell interface. Image is representative of eight sets of images from one experiment out of four independent experiments. Scale bar: 10 µm. (F) Quantification of junctional CeFP (excitation CeFP, emission CeFP) and FRET (excitation CeFP, emission VFP) in young (1-day confluent) and mature (7-day confluent) cell monolayers expressing myo1c_sstFRET. The FRET index is expressed as FRET/(CeFP+FRET). Horizontal lines represent mean fluorescence intensities. P<0.001 for FRET index between young and mature junctions. Data are representative of eight image sets from one experiment out of four independent experiments. (G) Measurement of junctional CeFP (excitation CeFP, emission CeFP) and FRET (excitation CeFP, emission VFP) showing the decrease in FRET index during whole-cell contraction. Data are representative of three image sets from one experiment out of three independent experiments.

