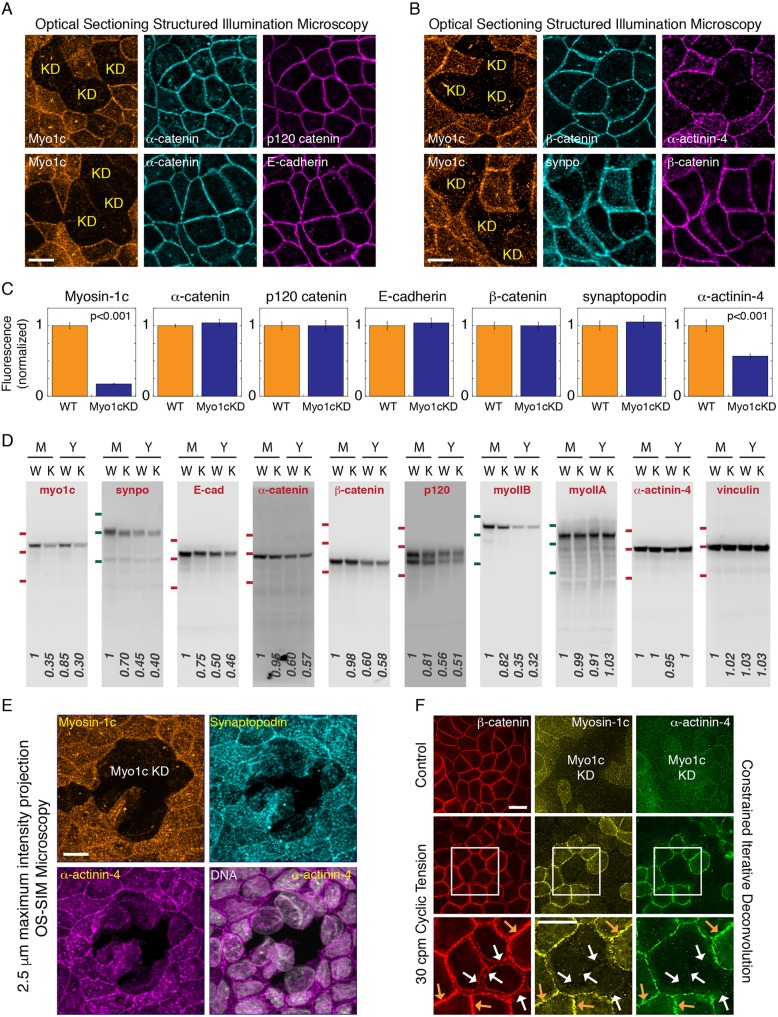
Fig. 7.
Myosin-1c knockdown abolishes junction recruitment of α-actinin-4 and weakens cell-cell cohesion. (A) OS-SIM images of myosin-1c (Myo1c), α-catenin, p120-catenin and E-cadherin at the apical plane of heterogeneous myosin-1c knockdown (KD) cell monolayers. Data are representative of 12 sets of images from one experiment out of three independent experiments. (B) OS-SIM images of myosin-1c, β-catenin, synaptopodin (synpo) and α-actinin-4 at the apical plane of heterogeneous myosin-1c knockdown cell monolayers. Data are representative of 12 sets of images from one experiment out of three different independent experiments. (C) Quantification of junctional myosin-1c, α-catenin, p120-catenin, E-cadherin, β-catenin, synaptopodin and α-actinin-4 immunofluorescence in wild-type (WT) and myosin-1c knockdown (Myo1cKD) cells. Bar graphs show the normalized mean±s.e.m. intensity of 24 junctions. P<0.001 for myosin-1c and α-actinin-4 between WT and myosin-1c KD. Data are representative of one experiment out of three independent experiments. (D) Western blots for myosin-1c, synaptopodin, E-cadherin (E-cad), α-catenin, β-catenin, p120-catenin, myosin IIB (myoIIB), myosin IIA (myoIIA), α-actinin-4 and vinculin in total cell lysates from mature (M, 7-day confluent) and young (Y, 1-day confluent) monolayers of wild-type (W) and myosin-1c knockdown (K) cells. Data are representative of one set of experiments out of four independent experiments. Red lines indicate the position of molecular mass markers at 135, 100 and 75 kDa; green lines indicate the position of molecular mass markers at 180, 135 and 100 kDa. (E) Maximum intensity projections from a 2.5 µm z-stack of 0.2 µm OS-SIM z-images showing immunofluorescence of myosin-1c, synaptopodin and α-actinin-4 in the mature cell monolayer with heterogeneous knockdown of myosin-1c (Myo1c KD). DNA (Hoechst 33528) is shown in merge image with α-actinin-4. Image set is representative of 12 image sets from one experiment out of six independent experiments. Scale bar: 10 µm. (F) Constrained iterative deconvolved microscopy showing immunofluorescence of myosin-1c, α-actinin-4 and β-catenin in a young monolayer with heterogeneous myosin-1c knockdown (Myo1c KD) that has been untreated (control) or subjected to cyclic tension [30 cycles per min (cpm)]. Orange arrows show unperturbed junctions that have myosin-1c at the junction; white arrows show broken junctions in myosin-1c-depleted cells. Image set is representative of eight image sets from one experiment out of four independent experiments. Scale bars: 10 µm.

