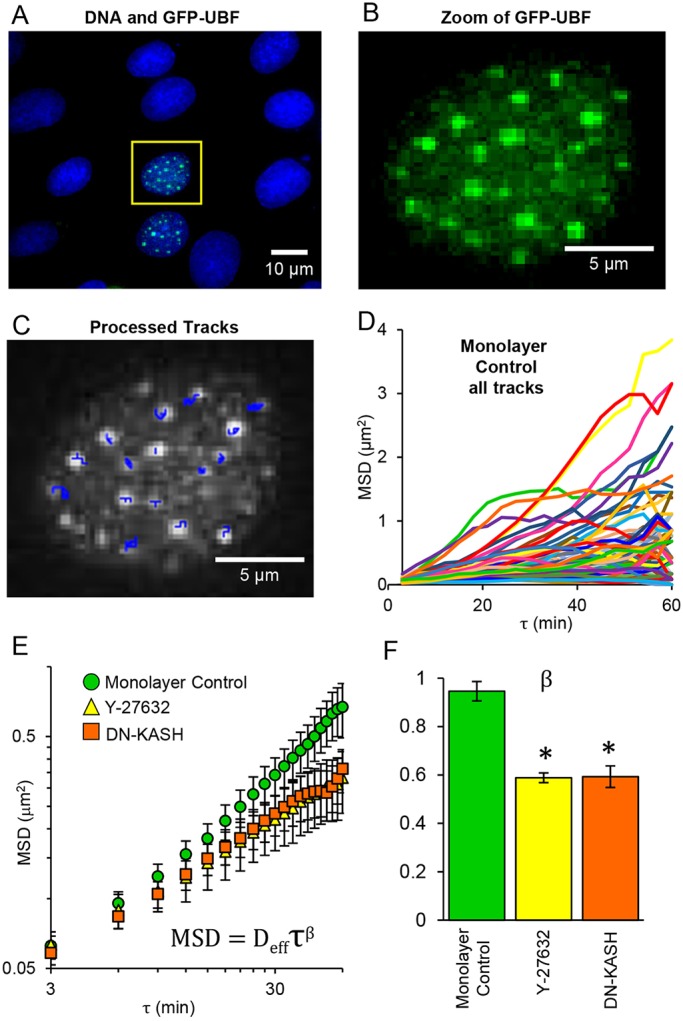
Fig. 1.

SINK method and mechanisms of intracellular force propagation reduction. (A) Monolayer of NRK-52E epithelial cells showing two cells expressing GFP-UBF (green); DNA is stained blue with Hoechst 33342. (B) Magnified image of outlined nucleus in A showing only the GFP-UBF channel. (C) Processed frame of B after imaging nucleus at 3 min time intervals for 60 min. Tracks of points are shown as blue overlay. Nuclei were aligned prior to tracking of points. (D) Tracks from all points in all nuclei for the control monolayer data shown on linear coordinates. (E) MSD average of intranuclear movement versus lag time (τ) plotted on log-log coordinates for control cells in a monolayer (green), cells in a monolayer treated with Y-27632 (yellow), and cells in a monolayer transfected with DN-KASH (orange). Error bars represent s.e.m. Data are fitted to a power law of the form shown. (F) Comparison of the force generation exponent (β) for control cells in a monolayer, Y-27632 and DN-KASH monolayers. Reduction of either cell force generation (Y-27632) or nuclear connectivity (DN-KASH) resulted in decreased β. Asterisk denotes significant difference based on the curve fit (P<0.05). Error bars represent 95% confidence interval for the fitting of β. Monolayer control, n=84; Y-27632, n=101; DN-KASH, n=64.
