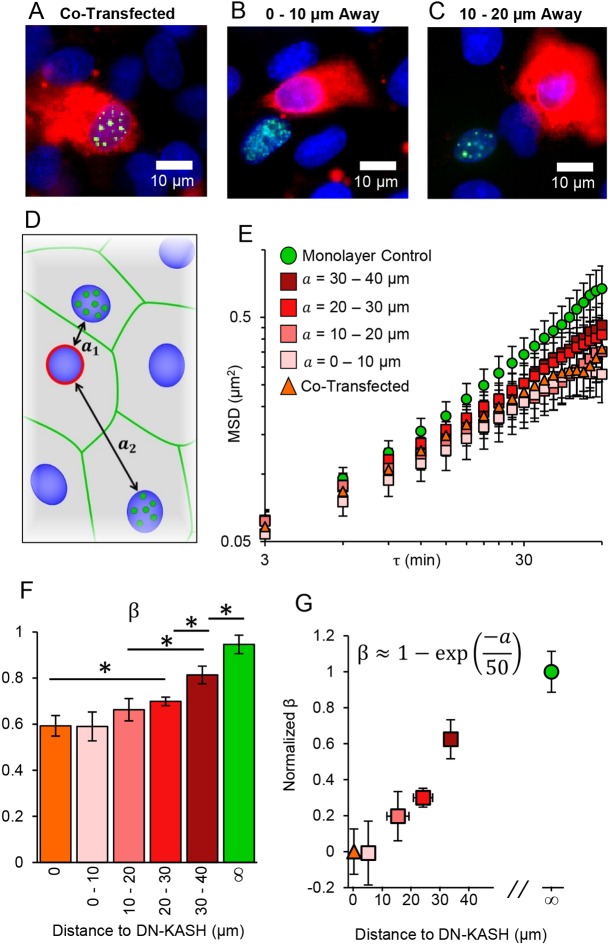
Fig. 4.
SINK method to measure changes in force in heterogeneous monolayers. (A-C) GFP-UBF (green)-expressing nuclei (blue) with DN-KASH (red) being expressed in the same cell (A), a cell 0-10 µm away (B) or a cell 10-20 µm away from the GFP-UBF-expressing cell (C). Distances measured represent nearest nucleus to nucleus distance to a DN-KASH-expressing nucleus. (D) Schematic of target cells expressing GFP-UBF (green dots) at various distances (a) from a DN-KASH-expressing cell (red outline). (E) MSD versus lag time for DN-KASH-expressing cells, cells of varying distances from DN-KASH and control monolayer cells. Nearby cells have similar intranuclear motion to co-transfected cells. MSD increases as cells are further from a DN-KASH-expressing cell. Error bars represent s.e.m. (F) Comparison of the force generation exponent (β) for nuclei transfected with DN-KASH (orange), or at different distances away from a DN-KASH-expressing cell (shades of red) as well as monolayers not transfected with DN-KASH (green). Error bars represent 95% confidence interval for the fitting of β. (G) Plot of the normalized β value versus distance away from DN-KASH. The data were fitted as an exponential of the form β=1–exp(−a/n), where a is the distance (in µm) away from a DN-KASH-expressing nucleus. The parameter n is a spatial parameter such that forces at a distance n (in µm) no longer feel the majority of the effects of the DN-KASH-expressing cell, ∼50 µm based on the fit. The R2 for the fit was 0.93. Y error bars are 95% confidence intervals of β after normalization. X error bars are the s.d. of distance away from DN-KASH for the non-adjacent cells. Monolayer control, n=84; a=30-40 um, n=50; a=20-30 um, n=132; a=10-20 um, n=93; a=0-10 um, n=185; co-transfected, n=64.

