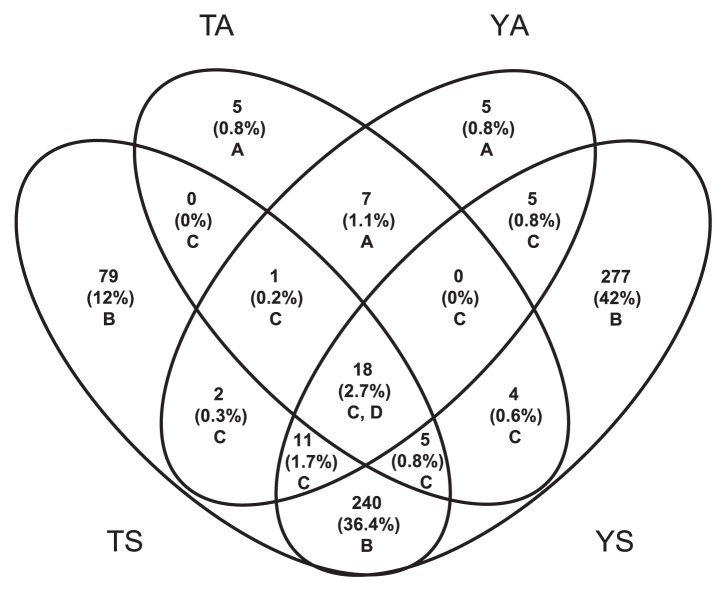
Fig. 3.
Venn diagram of shared OTUs and groups. A indicates the 17 bacterial OTUs obtained only from air above the two lakes; B indicates the 596 bacterial OTUs obtained only from the lakes; C indicates the 46 bacterial OTUs obtained in both lakes and air samples; and D indicates the 18 OTUs found in all four habitats.

