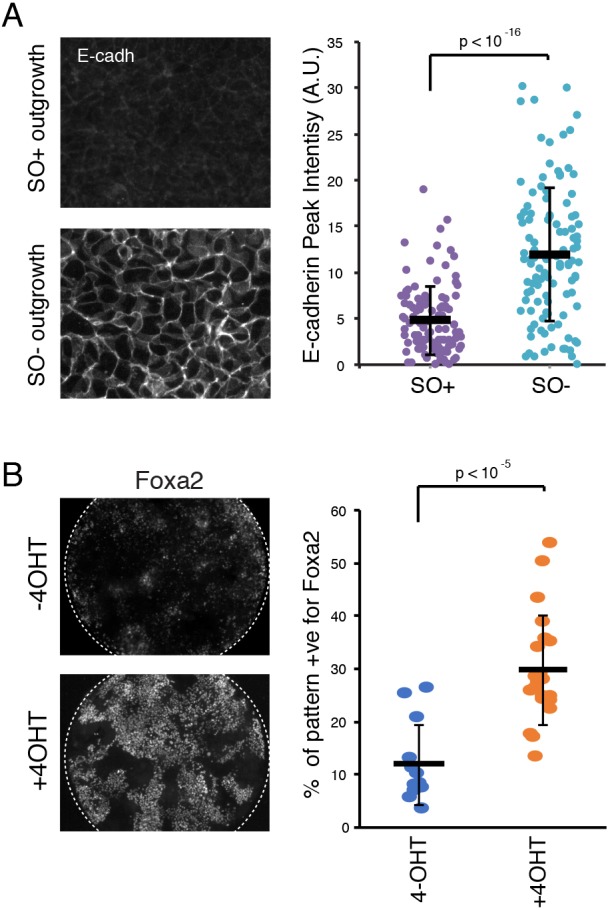
Fig. 7.

Recapitulation of SO− phenotypes in vitro. (A) Immunostaining and quantification of E-cadherin in SO+ and SO− epiblast outgrowths dissected at E6.5 and cultured for 48-72 h in N2B27. Data are mean±s.d. (B) Immunostaining and quantification of Foxa2 expression in IOD cells cultured in EpiLC media conditions in the presence (bottom) or absence (top) of tamoxifen (4-OHT). Data are mean±s.d.
