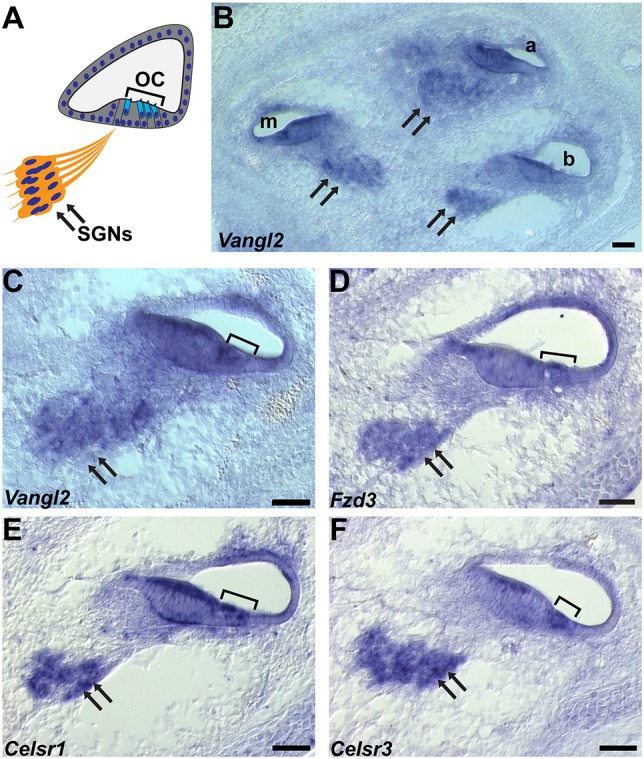
Fig. 2.

Core PCP gene expression in the mouse cochlea. (A) A schematic representation of a cochlear cross-section showing the location of the SGN (arrows), organ of Corti (OC) and hair cells (bracket). (B-F) In-situ hybridizations of the E16.5 cochlea show Vangl2 (B,C), Fzd3 (D), Celsr1 (E) and Celsr3 (F) gene expression in the SGN and cochlea. a, apical; m, middle; b, basal turns of the cochlear duct. Scale bars: 50 µm.
