Fig. 7.
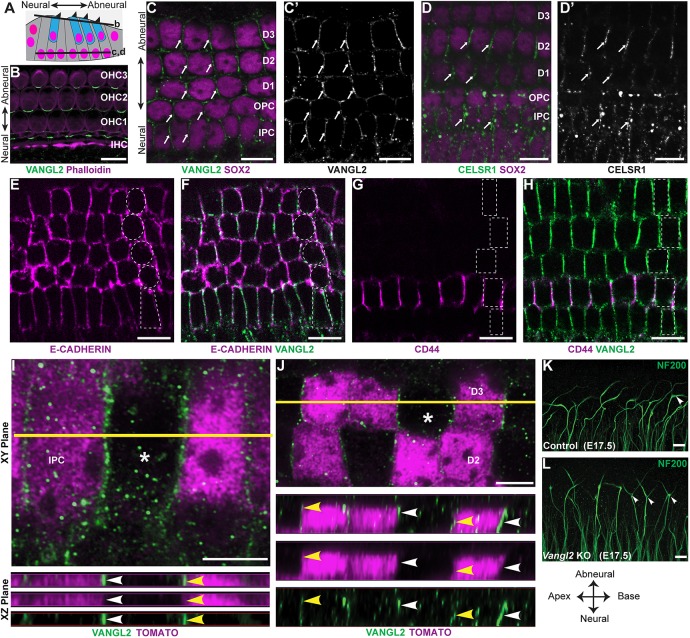
Vangl2 is asymmetrically distributed along the basolateral wall of supporting cells. (A) Schematic representation of the organ of Corti highlighting the relative position of hair cells (blue) and supporting cells (gray), and the ‘z-position’ of optical sections corresponding to B-D. (B) At the apical surface of the organ of Corti, VANGL2 is asymmetrically distributed at hair cell to supporting cell boundaries, perpendicular to the neural:abneural axis of the cochlea. The organization of hair cells and supporting cells is revealed by phalloidin staining of filamentous actin. (C,C′) At deeper z-positions, VANGL2 is asymmetrically distributed at cell boundaries (arrows) between the basolateral walls of supporting cells, identified by SOX2 immunolabeling. At this z-position, VANGL2 is asymmetrically distributed at boundaries oriented parallel to the neural:abneural axis of the cochlea. (D,D′) The distribution of CELSR1 (arrows) is similar to VANGL2 at boundaries between neighboring supporting cells. (E,F) Colocalization with the basolateral marker E-cadherin (magenta) confirms the basolateral distribution of VANGL2 (green). (G,H) Immunolabeling for the OPC-specific marker CD44 (magenta) confirms that, in this z-position, VANGL2 (green) is present at intercellular junctions between neighboring supporting cells. (I) Super-resolution imaging of VANGL2 at the boundaries between IPCs following sparse genetic labeling by Fgfr3-iCreER; tdTomato to resolve the border between neighboring cells. Asterisk shows a wild-type cell flanked by labeled cells. Yellow line marks the position of projections further evaluated in the xz plane. Arrowheads indicate the asymmetric distribution of VANGL2 on one side of wild-type (white) or Fgfr3-iCreER-labeled (yellow) IPCs facing the cochlear apex. (J) Super-resolution imaging of VANGL2 at the boundaries between Dieters cells (D3) following sparse genetic labeling by Fgfr3-iCreER; tdTomato. Asterisk shows a wild-type cell flanked by labeled cells. Yellow line marks the position of projections further evaluated in the xz plane. Arrowheads indicate the asymmetric distribution of VANGL2 on the side of wild-type (white) or Fgfr3-iCreER-labeled (yellow) IPCs facing the cochlear apex. (K,L) Frequent appearance of bifurcated growth cones (arrowheads) in the middle turn of cochlea from E17.5 Vangl2 KOs compared with the littermate controls. Dashed outlines indicate the relative position of supporting cells. Scale bars: 10 µm in B-H,K,L; 5 µm in I,J. The anatomical reference applies to B-L.

