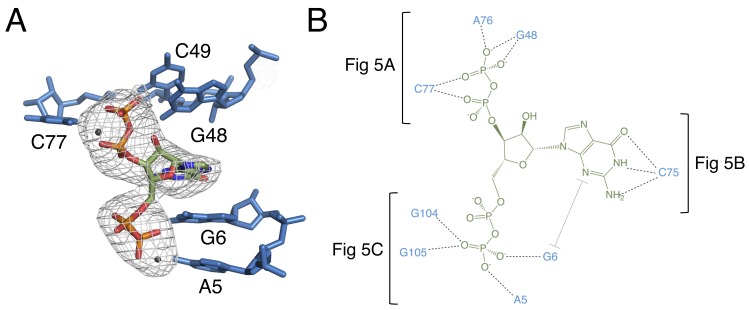
Figure 4. The binding pocket of the G96A mutant in complex with ppGpp.
(A) Crystal structure of the ligand-binding site in chain A. ppGpp is depicted as sticks and colored by element with green carbons. Nucleotides are depicted as blue sticks. Metal ions are depicted as gray spheres. Individual nucleotides are labeled. An FO–FC map contoured at 3.0 σ is shown as a gray mesh. The map was calculated using an otherwise complete model lacking ppGpp and nearby metals. Relative to Figure 1, the structure is rotated 180° about the y axis. (B) Ligand interaction map. The map is colored essentially as in A. All RNA contacts to ppGpp are shown. Dashed black lines indicate hydrogen bonds. The grey bracket indicates base stacking. Black brackets indicate interactions shown in individual panels of Figure 5.


