. 2018 Jun 11;7:e26957. doi: 10.7554/eLife.26957

Figure 2. G1 length is negatively correlated with nuclear size at birth.

(A) A significant correlation between cell size and nucleus size suggests that nucleus size is an adequate proxy measurement of cell size. We imaged unsynchronized, unperturbed HeLa cells with time-lapse microscopy and monitored the size of their nuclei (estimated as the area covered by the nucleus in a widefield image), as a proxy for cell size. Datapoints (red) represent single-cell measurements of cell size (SE-A647 fluorescence) and nucleus size (projected area) in a population of HeLa cells. Also shown is the linear regression (blue line) between cell size and the size of the nucleus and the calculated Pearson correlation (r=0.68). Black contour lines represent the calculated joint probability density function, describing the frequency of cells for every given paired value of cell size and nucleus size. (B) Joint probability density functions of cell size and nucleus size for cells of different age groups, that is cells 2-5 hours after their most recent cell division (black), cells 8-11 hours after cell division (blue), and cells 14-17 hours after cell division (red). For (A–C), single cell measurements of cell age, cell size and nucleus size were performed on a large population of HeLa cells, as described for Figure 1. Measurements were performed in multiplex, such that all three parameters were quantified for each individual cell. We then sorted the single cell measurements into bins defined by cell age and separately calculated the joint probability of cell size and nucleus size for each age group. The figure demonstrates that the correlation of cell size and nucleus size consistently persists for cells of different ages. (C) Average cell size and nucleus size for cells of different age groups, as described in (B). This figure shows that as cells age, they increase in both nucleus size and cell size. Error bars represent standard error calculated as stdn . The significant separation of the datapoints (in relation to errorbars) demonstrates that our cell size measurements and nucleus size measurements are sufficiently accurate to resolve average size differences that result from < 3 hours of growth, approximately 15% of cell cycle duration. (D) Size (area covered in widefield fluorescence image) of HeLa nucleus 1.25 hours after birth vs. G1 duration. Line shows least-squares linear fit. Pearson’s r = −0.41, p=6.7 x 10−8 (p-value calculated using a Student's t distribution for transformation of the correlation). Inset shows distribution of Pearson’s r-values generated by randomizing the data, with arrow marking the r-value of non-randomized data. Data shown in (D) are representative example of four biological replicates, n=158 cells. The raw data and source code necessary to generate (A–D) are included in Figure 2—source data 1.

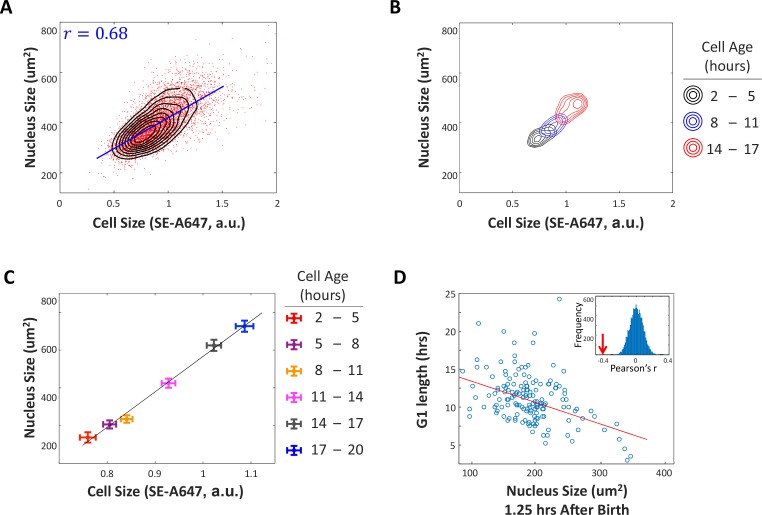
Figure 2—source data 1. File contains the source code and source data necessary to generate Figure 2 and Figure 2—figure supplement 2 using Matlab.
Figure_2ABC_2S2.m generates Figures 2A, B and C, as well as Figure 2—figure supplement 2. Figure_2D.m generates Figure 2D. Source data include individual measurements of cell age, cell size (total SE-A647 intensity), and nucleus size.
DOI: 10.7554/eLife.26957.011

Figure 2.

Figure 2—figure supplement 1. Monitoring growth of the nucleus in cycling cells.

Figure 2—figure supplement 1.

(A) Images show a HeLa cell expressing the Fucci cell cycle reporters (Sakaue-Sawano et al., 2008) at several time points during a single cell cycle. Widefield fluorescence images of mKO2-hCdt1 (red) and mAG-hGem (green) are overlaid on grayscale phase-contrast microscopy image. (B) To monitor nuclear growth over time in single cells, widefield fluorescence and phase contrast images like those shown in (A) were collected at 15 min intervals, as described in Materials and methods: Time-lapse microscopy. Cells were tracked yielding trajectories of projected nuclear area and cell cycle reporter levels, which are used to cut out and synchronize single-cell-cycle trajectories by the time of cell birth (see Materials and methods: Monitoring nuclear growth in live cells). The rapid fluctuations in the nuclear size trajectories at the onset of mitosis reflect the breakdown of the nuclear envelope, at which time the nuclear-localized fluorescent probes flood the cell. The mitosis segment of each trajectory was trimmed away before data were analyzed, to remove this artifact.
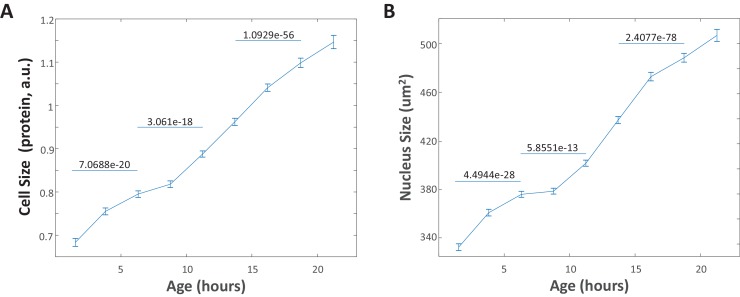
Figure 2—figure supplement 2. Changes in nucleus size mimic changes in cell size.

Figure 2—figure supplement 2.

(A) Average cell size (SE-A647 intensity) vs. cell age plotted for a representative population of unsynchronized HeLa cells. Each data point marks the mean size of cells with ages within a 2.25 hr window, centered at that data point. Error bars represent the standard error of the mean. To illustrate that changes occurring in the cell size distribution over the course of a few hours are well-resolved, the p-values generated by a two-sample t-test comparing the two size distributions are shown for several pairs of data points. (B) Average nucleus size vs. cell age plotted as described in (A) for the same cells represented in (A). The raw data and source code necessary to generate this figure are included in Figure 2—source data 1.
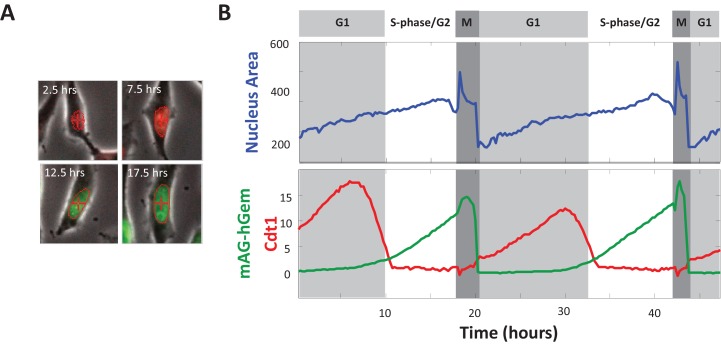
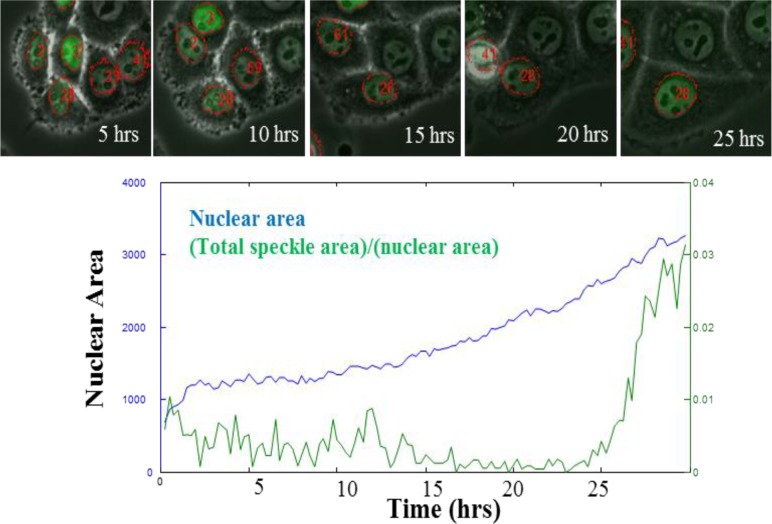
Figure 2—figure supplement 3. Nucleus grows with cell during aphidicolin arrest.

Figure 2—figure supplement 3.

Images show HeLa cells, transfected with DNA-ligase-I-dsRed (gift from M. Cristina Cardoso, described in Cardoso et al., 1997), at several time points during a 25 hr incubation in aphidicolin. Widefield fluorescence images of DNA-ligase-I-dsRed (green) are overlaid on grayscale phase-contrast microscopy image. Red outlines mark nuclear boundaries. Red numbers label cells that were tracked throughout the time-lapse movies acquired during aphidicolin treatment. Nuclear size for the cell labeled 28 is plotted below (blue). Green trace quantifies the density of DNA-ligase foci within the nucleus, showing that cell does not enter S-phase for 25 hr.