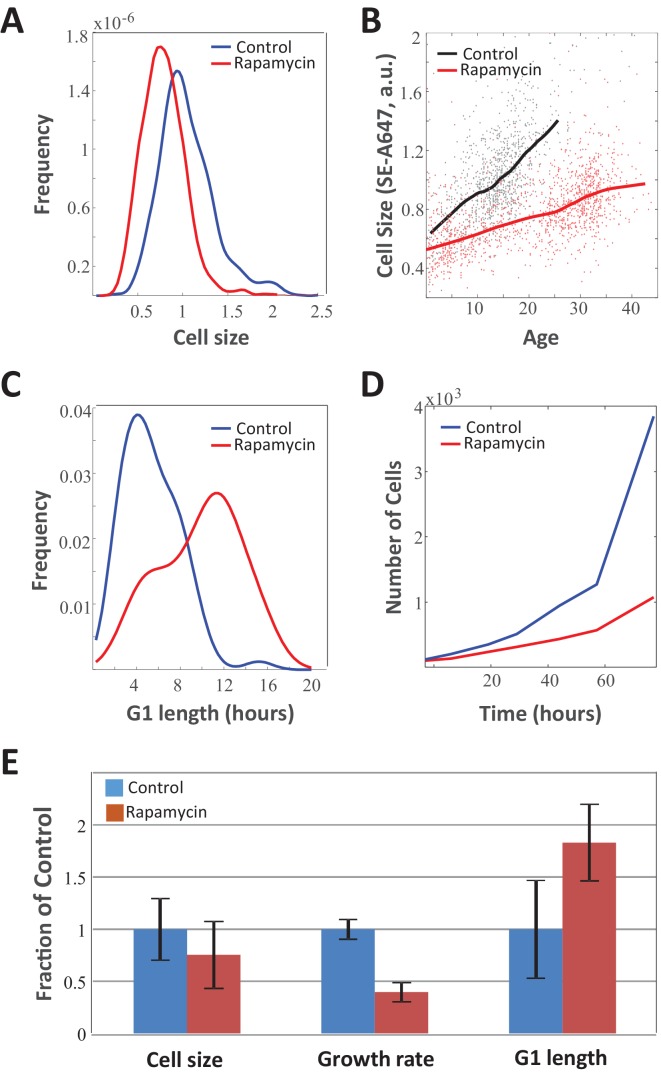
Figure 3. Slow growth rate in mTOR-inhibited cells is counteracted by increase in G1 duration.
Unsynchronized Rpe1 cells were cultured in the absence or presence 70 nM rapamycin for a period of 3 days. The distribution of (A) cell size (protein content assayed by SE-A647 fluorescence), (B) average growth rate, (C) G1-length, and (D) proliferation rate were obtained as described in the Materials and methods section. Solid lines in (B) show mean size vs. age for control and rapamycin-treated cells, while points represent single cell measurements. (E) Bar plot comparing the influence of rapamycin on growth rate, G1 length, and cell size. Bar heights represent mean, error bars represent standard deviation (n = 975 cells in control, n = 1268 cells in rapamycin). Data shown are representative examples of two biological replicates (full experimental repeats). The raw data and source code necessary to generate (A–B) are included in Figure 3—source data 1.

