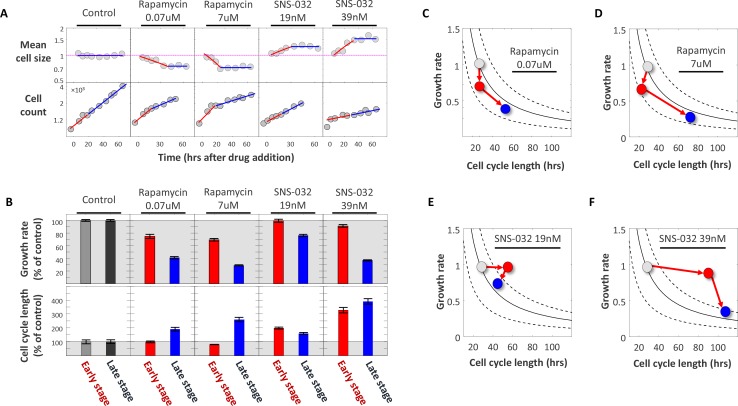
Figure 6. Using SNS-032 and rapamycin to examine the coordination of growth rate and cell cycle length.
Populations of Rpe1 cells were treated with DMSO (control), rapamycin and SNS-032. Each of the two drugs was used at two different concentrations, as indicated by the plot titles. (A) Measurements of average cell size with SE-A647 (top panel) and cell count (bottom panel) were performed (as described in the Materials and methods section) at different time points after drugs were added. Note log scale of y-axes. Each cell size datapoint is an average from a population of >2000 cells. Values of cell size are normalized to control, such that average cell size of the control populations has the value of 1. (B) Average growth rate (top panel) and cell cycle length (bottom panel) calculated from data shown in (A). Cell cycle length was calculated by fitting exponential curves to measurements of cell count over time shown in the bottom panel of (A). For each drug treatment, two separate estimates of growth rate and two separate estimates of cell cycle length were calculated; one for the early stage of the time course (red) and one for the late stage (blue), as described in the text. The separate estimates were calculated by fitting the time course data in (A) with two separate regressions, indicated by the blue and red regression curves in (A). Values of growth rate and cell cycle length are shown as percent of control. Shaded (gray) area marks growth rate and cell cycle length in the control populations. (C–F) Data from (B) are plotted as average growth rate versus cell cycle length for each of the separate drug treatments. Data points are color coded with the same color scheme that is used in the bar-plot (B), that is colors represent the temporal stages of the drug treatments: gray data-points represent measurements on control populations prior to drug treatment, red data-points represent measurements of populations during the early stage of drug treatment, and blue data-points represent measurements of populations during the late stage of drug treatment. Trend-lines are defined by , where is a constant that defines a cell’s target size. In other words, all points on a given trend-line represent paired values of growth rate and cell cycle length that correspond to a single fixed, constant product, . An important observation emphasized by panels C-F is that, while drug treatments cause a change in both and , the product, , is only temporarily perturbed and returns close to its homeostatic value in the late stage of drug treatment. This is seen by the fact that only the red datapoints fall off the trendlines. Also, the panels clearly highlight the distinction in the order of events that result from cell cycle inhibitors versus growth rate inhibitors, as explained in the text. The raw data and source code necessary to generate (A–F) are included in Figure 6—source data 1.

