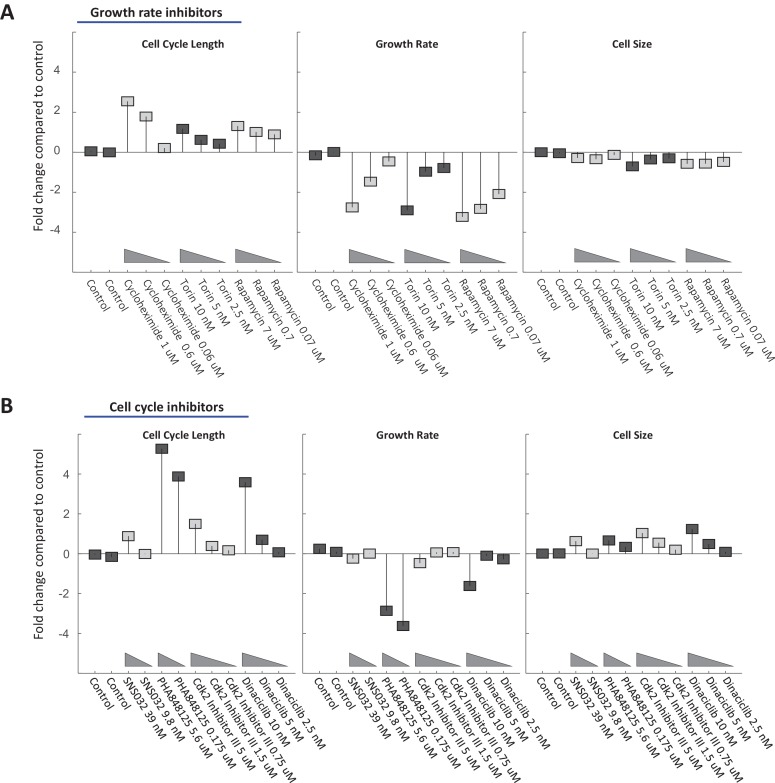
Figure 7. Cell size is stabilized by a compensatory relationship between cell cycle length and growth rate.
Rpe1 cells were treated with varying doses of drugs inhibiting growth (A) or cell cycle progression (B). The fold change in mean cell cycle length (left panel), growth rate (middle panel), and cell size (right panel), relative to untreated cells, is plotted for each condition. The mean cell cycle length and mean growth rate of cells in each condition were calculated from measured increases in bulk protein and number of cells over the course of a 68 hr incubation, as described in the text. Mean cell size (protein content assayed by SE-A647 staining) was measured after 44 hr of incubation in each condition. To better characterize their influence, all drugs were applied at a range of concentrations, as indicated by the titles in the x-axes. The drug concentrations shown were found to be non-toxic and meet the following two criteria in preliminary tests: (i) They cause a detectable effect on growth rate and/or cell cycle progression. (ii) They do not block proliferation entirely. Each drug treatment was done in duplicate, alongside six control (DMSO) samples, with several thousand cells in each sample. Fold-changes are shown relative to the average cell cycle length, growth rate, and cell size of all six control samples. The raw data and source code necessary to generate (A–B) are included in Figure 7—source data 1. The drugs used and their targets are as follows: mTOR inhibitors (Torin and Rapamycin), protein synthesis inhibitor (Cycloheximide), cdk1/2 inhibitors (SNS-032, cdk2 Inhibitor II, PHA848125, Dinaciclib).


