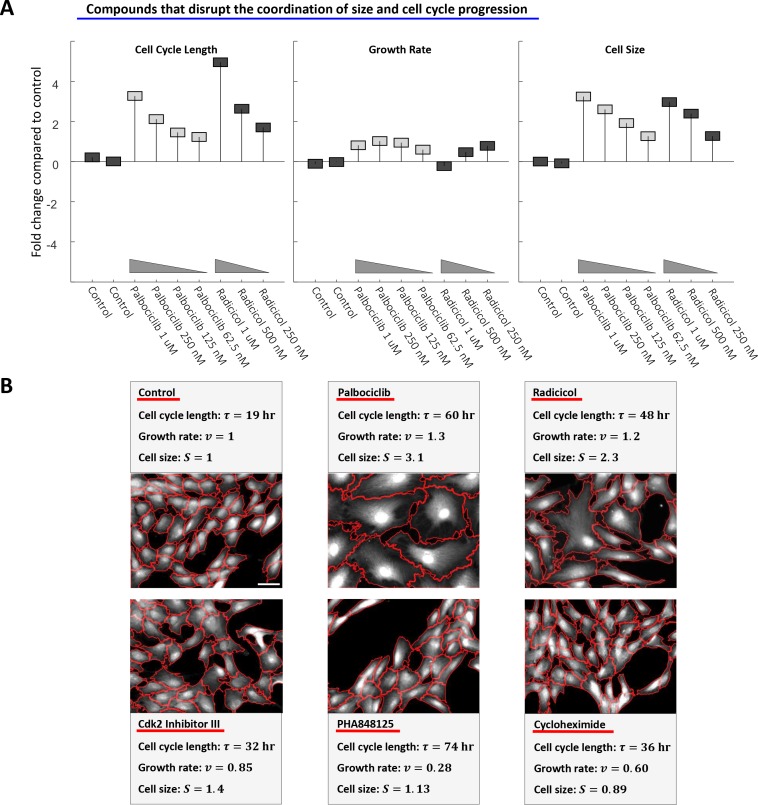
Figure 8. Perturbing the relationship between cell cycle length and growth rate.
(A) Rpe1 cells were treated with varying doses of palbociclib (cdk4/6 inhibitor) or radicicol (hsp90 inhibitor). (A) The fold change in mean cell cycle length (left panel), growth rate (middle panel), and cell size (right panel), relative to untreated cells, is plotted for each condition. The mean cell cycle length and mean growth rate of cells in each condition were calculated from measured increases in bulk protein and number of cells over the course of a 68 hr incubation, as described in the Materials and methods and Results sections. Mean cell size (protein content assayed by SE-A647 staining) was measured after 68 hr of incubation in each condition. Each drug treatment was done in duplicate, alongside six control (DMSO) samples, with several thousand cells in each sample. Fold-changes are shown relative to the average cell cycle length, growth rate, and cell size of all six control samples. (B) Representative widefield fluorescence images (SE-A647 stain) of unperturbed cells and cells treated with 600 nM cycloheximide, 175 nM PHA848125, 5 uM Cdk2 Inhibitor III, 500 nM palbociclib, or 500 nM radicicol. All images are shown at the same scale, scale bar = 50 um. Red lines delineate cell boundaries. The raw data and source code necessary to generate (A) are included in Figure 8—source data 1.


