. 2018 Jun 11;7:e26957. doi: 10.7554/eLife.26957

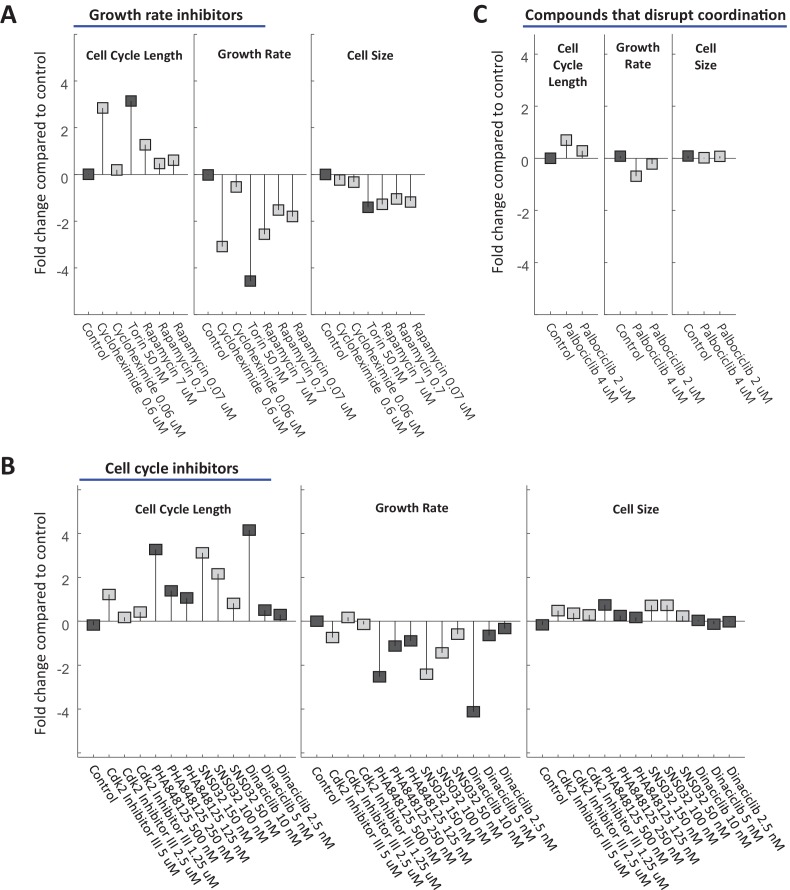
Figure 9. Compensatory relationship between cell cycle length and growth rate.

(A) Rpe1 cells were treated with varying doses of drugs inhibiting growth or cell cycle progression, as described in the legends of Figures 7 and 8. Mean growth rate vs. mean cell cycle length are plotted for cells in each condition shown in Figure 7. Cyan circles represent unperturbed cells (DMSO). Gray circles represent the inhibitors of growth or cell cycle progression shown in Figure 7A and B. Red circles (palbociclib) and yellow circles (radicicol) represent the conditions that disrupt the coordination of cell growth and cell cycle progression shown in Figure 8A. Mean growth rate vs. mean cell cycle length are also plotted for stable Rpe1 cell lines inducibly overexpressing cell cycle regulators (diamonds). Green diamond represents overexpression of cyclin E1 (average of four replicates, several thousand cells per sample), and red diamond represents overexpression of cyclin D1 (average of three replicates, several thousand cells per sample). Black lines mark iso-cell-size contours. Region between lines spans a 25% shift in cell size. Calculation of the Pearson correlation coefficient between log(growth rate) and log(cell cycle length), using data from conditions marked by gray circles (inhibition of growth or cell cycle progression) and green diamond (cyclin E1 overexpression), yields r = −0.76, p=2.1×10⁻⁷, by two-tailed Student’s t-test, indicating a significant inverse correlation between growth rate and cell cycle length in these conditions. (B–E) The experiment presented in Figure 7 and Figure 8A was repeated in several additional cell lines. The resulting mean growth rate vs. mean cell cycle length plots are shown for U2OS (B), SAOS2 (C), HeLa (D), and 16HBE (E). The corresponding plots of fold change in cell cycle length, growth rate, and size in each condition, for these four cell lines, are shown in Figure 9—figure supplements 14. For (A–E), growth rates are measured in arbitrary units of accumulated SE-A647 intensity per hour. In each experiment, all calculated growth rates were divided by a scaling factor such that the average growth rate of control samples = 1, to aid in comparison between cell lines. The raw data and source code necessary to generate (A–E) are included in Figure 9—source data 1.

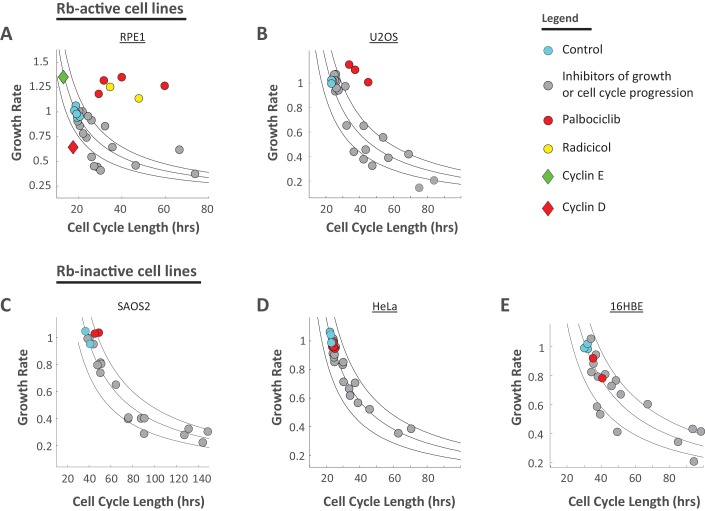
Figure 9—source data 1. File contains the source code and source data necessary to generate Figure 9 and its associated figure supplements, using Matlab.
Figure_9A.m generates Figure 9A, and Figure_9 .m generates Figure 9B–E and Figure 9—figure supplements 14. Source data include measurements of cell cycle length, cell size (total SE-A647 intensity), and cell count over time, under the conditions labeled in Figure 9—figure supplements 14.
DOI: 10.7554/eLife.26957.033

Figure 9.

Figure 9—figure supplement 1. U2OS cell size is stabilized by a compensatory relationship between cell cycle length and growth rate.

Figure 9—figure supplement 1.

U2OS cells were treated with varying doses of drugs inhibiting growth (A) or cell cycle progression (B), as well as drugs that were found to disrupt size specification in Rpe1 cells (C). The fold change in mean cell cycle length (left panel), growth rate (middle panel), and cell size (right panel), relative to untreated cells, is plotted for each condition. Experimental details as described in Figure 7. The raw data and source code necessary to generate this figure are included in Figure 9—source data 1.
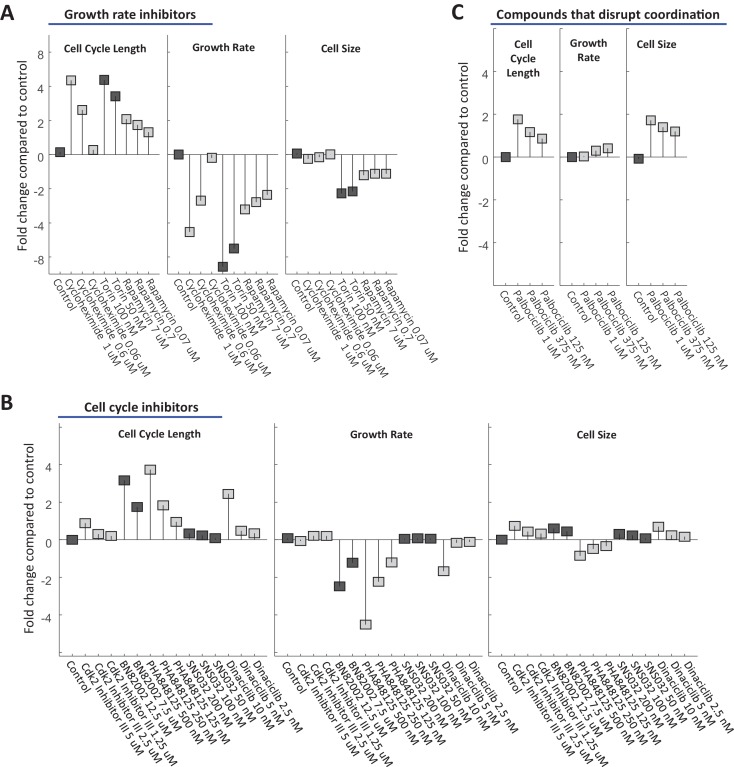
Figure 9—figure supplement 2. SAOS2 cell size is stabilized by a compensatory relationship between cell cycle length and growth rate.

Figure 9—figure supplement 2.

SAOS2 cells were treated with varying doses of drugs inhibiting growth (A) or cell cycle progression (B), as well as drugs that were found to disrupt size specification in Rpe1 cells (C). The fold change in mean cell cycle length (left panel), growth rate (middle panel), and cell size (right panel), relative to untreated cells, is plotted for each condition. Experimental details as described in Figure 7. The raw data and source code necessary to generate this figure are included in Figure 9—source data 1.
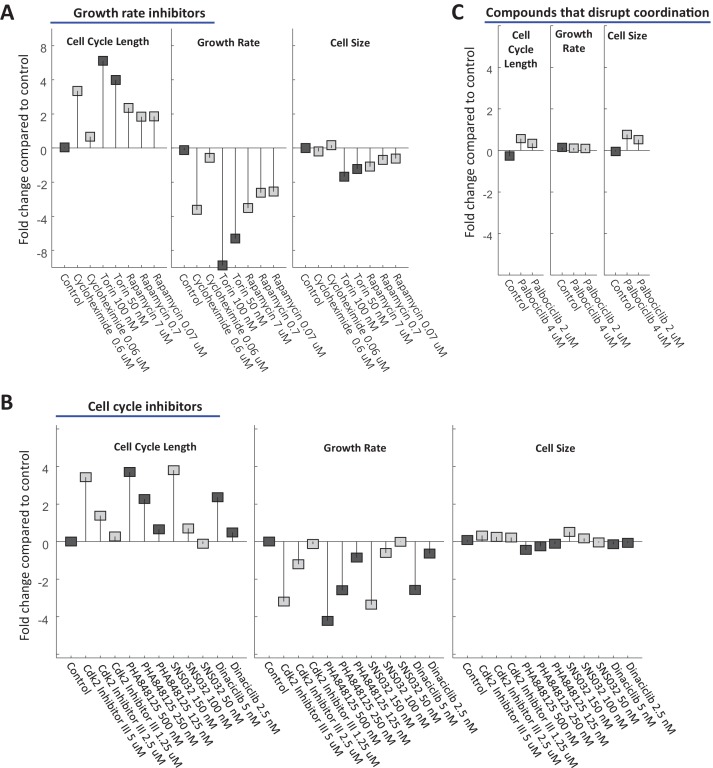
Figure 9—figure supplement 3. HeLa cell size is stabilized by a compensatory relationship between cell cycle length and growth rate.

Figure 9—figure supplement 3.

HeLa cells were treated with varying doses of drugs inhibiting growth (A) or cell cycle progression (B), as well as drugs that were found to disrupt size specification in Rpe1 cells (C). The fold change in mean cell cycle length (left panel), growth rate (middle panel), and cell size (right panel), relative to untreated cells, is plotted for each condition. Experimental details as described in Figure 7. The raw data and source code necessary to generate this figure are included in Figure 9—source data 1.
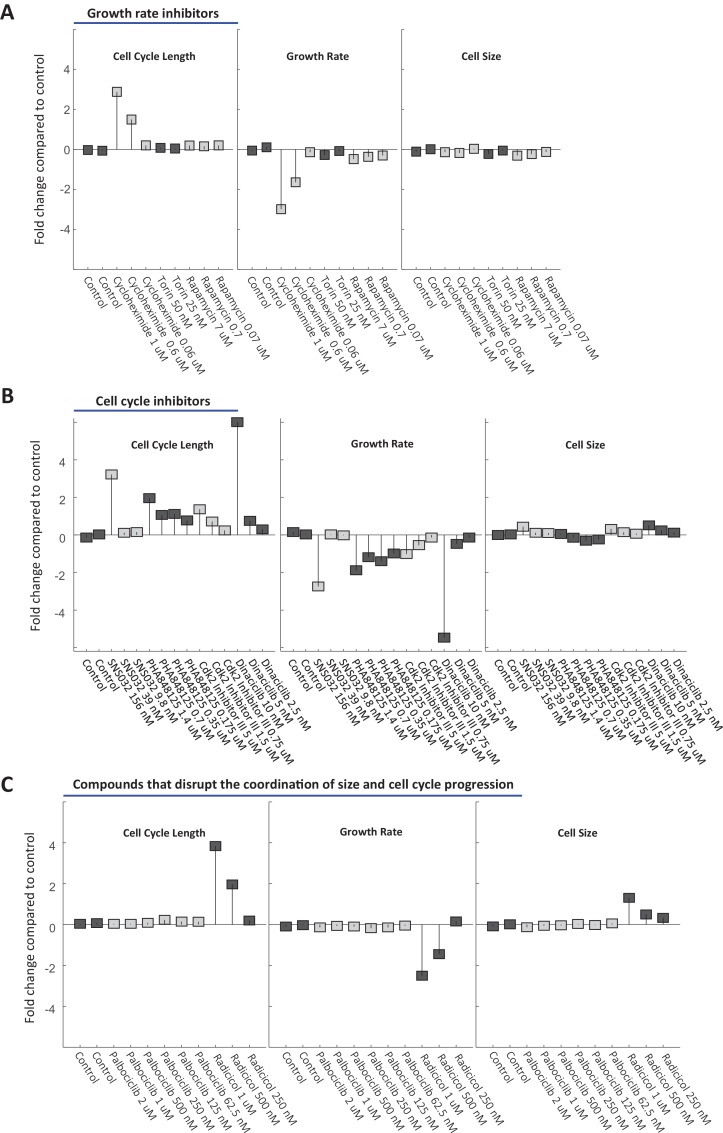
Figure 9—figure supplement 4. 16HBE cell size is stabilized by a compensatory relationship between cell cycle length and growth rate.

Figure 9—figure supplement 4.

16HBE cells were treated with varying doses of drugs inhibiting growth (A) or cell cycle progression (B), as well as drugs that were found to disrupt size specification in Rpe1 cells (C). The fold change in mean cell cycle length (left panel), growth rate (middle panel), and cell size (right panel), relative to untreated cells, is plotted for each condition. Experimental details as described in Figure 7. The raw data and source code necessary to generate this figure are included in Figure 9—source data 1.