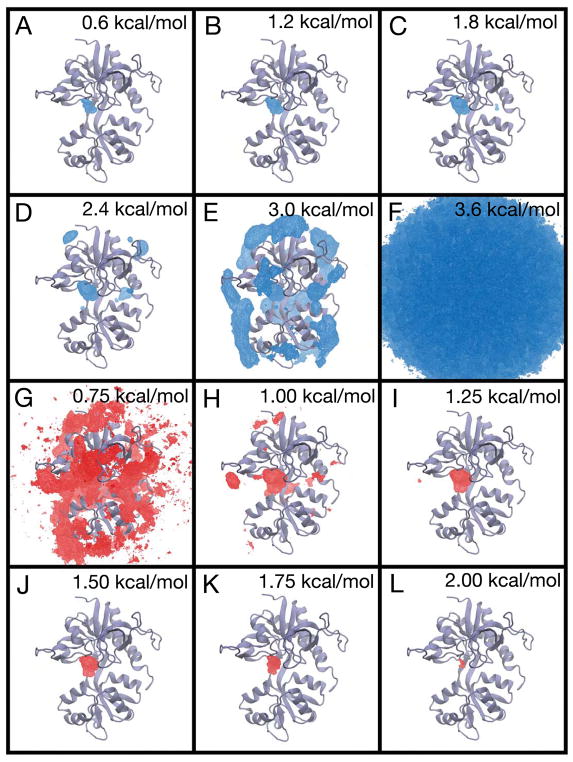
Figure 6.
The PMF for glycine binding to the GluN1 LBD and associated error analysis. (A–F) The free energy landscape is contoured from 0.6 kcal/mol to 3.6 kcal/mol in 0.6 kcal/mol increments. (G–L) The three-dimensional standard deviation of the PMF is shown contoured from 0.75 kcal/mol to 2.0 kcal/mol in increments of 0.25 kcal/mol. Ligand positions in bulk solvent (G) have low statistical uncertainty, with a standard deviation of < 0.75 kcal/mol. Ligand positions within the binding cleft (I–L) have higher statistical uncertainty, with a standard deviation ranging from 1.25 to 2.00 kcal/mol. Statistical uncertainty was determined using the block averaging approach.

