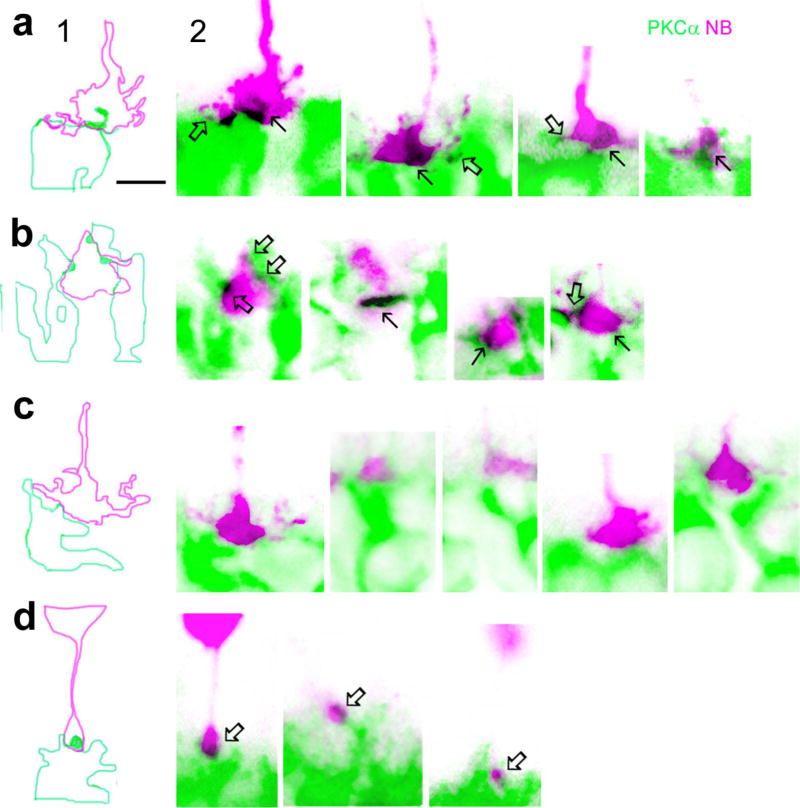
Fig. 3.
Comparison of mouse rod-RBC and cone-RBC contacts in confocal micrographs. Individual cones and rods were filled with NB and retinas were further labeled for PKCα. Images in panel 1 show outlines of RBC dendrites (green) and cone pedicles (pink) in the first image of panel 2 obtained by tracing the profiles with Photoshop software. a and b show invaginating cone-RBC contacts (in black, see arrows) where a RBC dendrite plugs deeply into the basal membrane of cone pedicles, as well as a few superficial cone-RBC putative synapses where RBC dendrites contact cone telodendrites and RBC dendritic spines bulge into the surface of cone pedicles (open arrows). c displays cone pedicles and adjacent RBC dendrites without forming synapses. d depicts rod-RBC invaginating synapses, where a single RBC dendritic spine inserts into the center of a small rod spherule (arrows). The scale bars are 5 µm.

