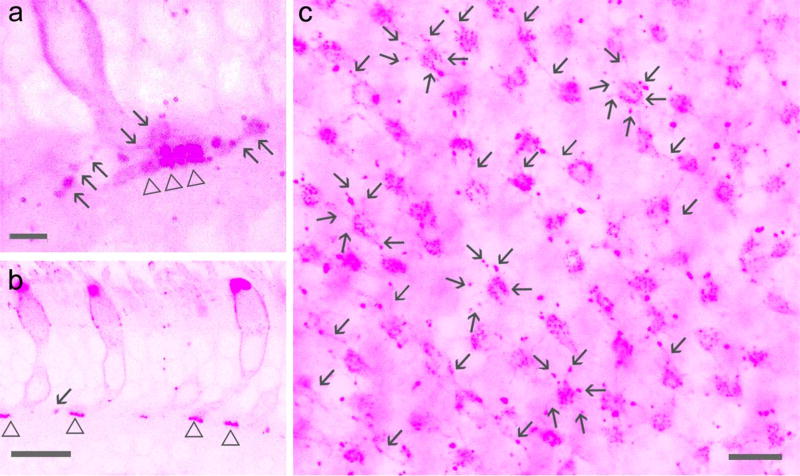
Figure 5.
Baboon cone pedicles and telodendrites labeled for PNA. Confocal micrographs show PNA-labeled cones (pink) in retinal slices (a, b) and flat-mounts (c). a and c are overexposed images. PNA signals appear as puncta in cone pedicles (triangle) and endings of cone telodendrites (arrow). Each cone pedicle sends out ~6 telodendrites. Sale bars are 1.5 µm in a and 20 µm in b and c

