
Figure 2.
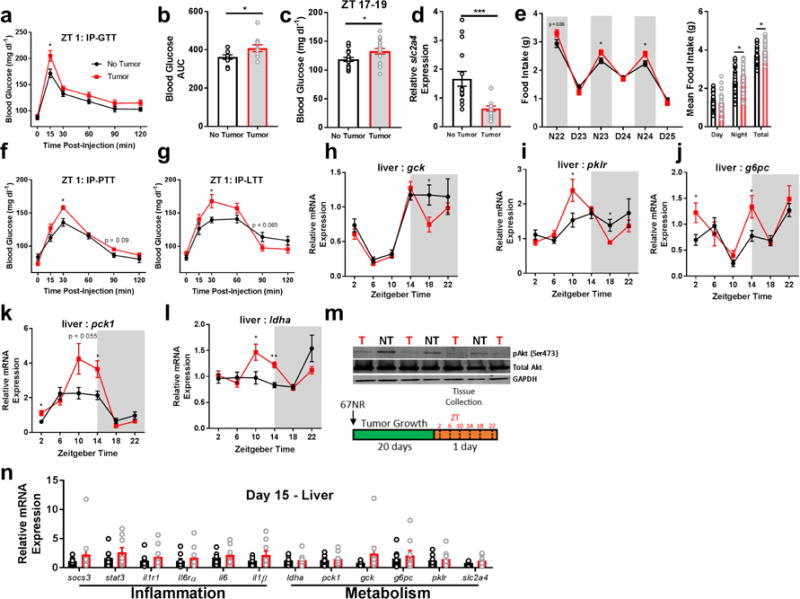
Non-metastatic tumors alter hepatic glucose metabolism. Tumor-bearing mice had impaired (a,b) glucose processing during a glucose tolerance test following an overnight fast (N = 10 no tumor, 9 tumor mice at 15 min post-injection, t = 2.599, p = 0.0187; N = 10/group for AUC, t = 2.134, p = 0.047), as well as (c) spontaneously higher glucose during the active phase (N = 19 no tumor, 18 tumor mice, t = 2.398, p = 0.0219). This was accompanied by (d) reduced expression of the insulin-dependent glucose transporter (slc2a4) (ZT 10, N = 15/group, t = 3.78, p = 0.0008), and (e) increased food intake (N23 N = 40/group, t = 2.251, p = 0.027; N24 t = 2.497, p = 0.0146), night average intake t = 2.542, p = 0.013; total intake t = 2.359, p = 0.021) and altered expression of gluconeogenesis and glycolysis pathway genes ‘around the clock’. (f) Tumor bearing mice enhanced gluconeogenesis in response to pyruvate (N = 15/group, 30 min post-injection, t = 3.43, p = 0.0019) and (g) lactate (N = 15/group, 30 min time point t = 2.534, p = 0.0174) challenges, (h) altered gck (N = 10/group for ZT 18, t = 2.365, p = 0.029), (i) pklr (N = 10 no tumor and 11 tumor for ZT 10, t = 2.23, p = 0.038; 9/group for ZT 18, t = 2.764, p = 0.014), (j) g6pc (N = 8 no tumor and 10 tumor at ZT 2, t = 2.258, p = 0.038; and 10 and 9 at ZT 14, t = 2.428, p = 0.0266), (k) pck1 (N = 10/group for ZT 2, t = 2.694, p = 0.015; 9/group for ZT 14, t = 2.792, p = 0.013), and (l) ldha (N = 9 no tumor and 12 tumor mice for ZT 10, t = 2.38, p = 0.028 ; 8/group for ZT 14, t= 5.105, p = 0.00016) as well as (m) reduced pAkt expression in the liver, indicating impaired insulin receptor signaling (ZT 10) (only relevant lanes of the western blot are shown). These changes in inflammation and metabolism were not evident until after day 15 following 67NR inoculation, as expression of all genes was equivalent between groups at this time (ZT 16) (n). (error bars represent S.E.M; *p < 0.05, **p < 0.01, ***p < 0.001; Student’s t-test).