
Figure 5.
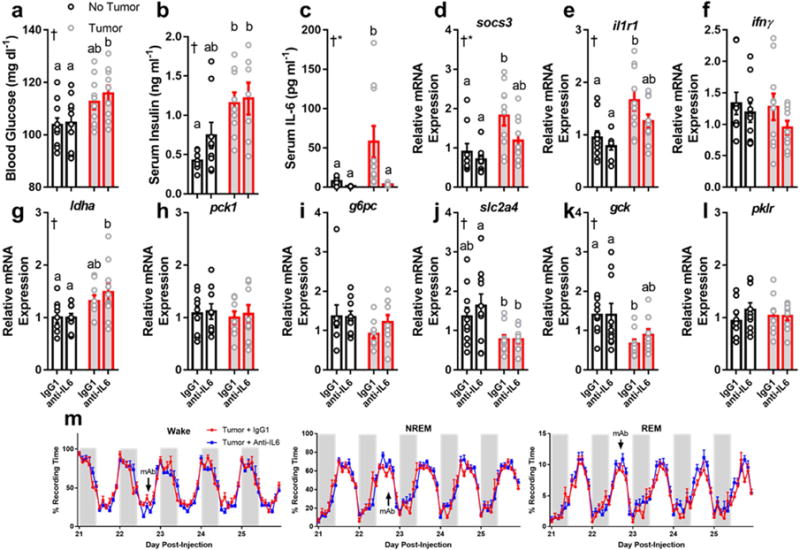
Neutralizing antibodies against IL-6 do not rescue metabolic or sleep phenotypes in tumor-bearing mice. Tumor-bearing mice increased (a) blood glucose (N = 10/group, main effect of tumor, F1,36 = 11.67, p = 0.0016) and (b) serum insulin (N = 8 no tumor IgG, 9 no tumor anti-IL-6, 9 tumor IgG, 7 tumor anti-IL-6, main effect of tumor, F1,29 = 16.46, p = 0.0003) regardless of whether they received anti-IL6 or the IgG1 isotype control (a total of three injections on days 15, 19, and 23). Despite successfully knocking down IL-6 (c) (N = 9 no tumor IgG, 7 no tumor anti-IL6, 10 tumor IgG and tumor anti-IL6; main effect of tumor F1,32 = 5.344, p = 0.027, main effect of antibody F1,32 = 7.016, p = 0.012, and an interaction among the two F1,32 = 4.391, p = 0.044) and IL-6 mediated socs3 expression (d) (N = 9 no tumor IgG and anti-IL6, 10 tumor IgG and anti-IL6, main effect of tumor, F1,34 = 12.34, p = 0.0013, main effect of antibody, F1,34 = 4.431, p = 0.043), but not il1r1 (N = 10/group except no tumor anti-IL6, main effect of tumor, F1,35 = 17.54, p = 0.0002) tumor bearing mice still showed deregulated expression of ldha (g) (N = 9 no tumor IgG and anti-IL6, 9 tumor IgG and 10 tumor anti-IL6, main effect of tumor, F1,33 = 10.3, p = 0.003), slc2a4 (j) (N = 10/group except 9 for tumor anti-IL6, main effect of tumor, F1,35= 11.79, p = 0.0015), and gck (k) (N = 10/group except 9 for tumor IgG, main effect of tumor, F1,35= 11, p = 0.0021), suggesting that IL-6 is not required for tumors to alter hepatic metabolism. Additionally, Anti-IL6 mAb treatment (single injection at day 22, denoted by “mAb” in figure) did not alter sleep in tumor bearing mice (m), demonstrating that IL-6 is not required for tumorinduced sleep disruption. (tissue collected at ZT 16) (Error bars represent S.E.M, † = main effect of tumor, * = main effect of antibody treatment, different letter headings represent multiple comparisons at p < 0.05, 2-way ANOVA; Tukey’s multiple comparisons test) (see Figure S8, 9).