Figure 2.

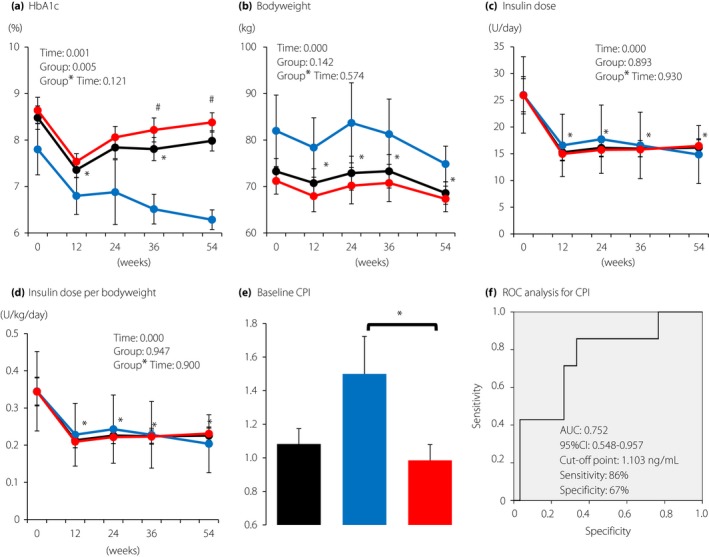
Changes during the 54‐week period in (a) glycated hemoglobin (HbA1c), (b) bodyweight, (c) insulin dose and (d) insulin dose per bodyweight. Black, all participants (n = 37); blue, patients with HbA1c < 7% at 54 weeks (n = 7); red, patients with HbA1c ≥ 7.0% at 54 weeks (n = 30). Each value represents the mean ± standard error of the mean. Time‐course curves were analyzed by mixed‐effects models including group, time, and the interaction of group and time, and the P‐values are shown. *P < 0.05 (vs 0 week) in all participants and # P < 0.05 (vs patients with HbA1c < 7.0% at 54 weeks) by the Mann–Whitney U‐test. (e) Comparison of C‐peptide index (CPI) in patients with HbA1c < 7.0% and those with HbA1c ≥ 7.0% at 54 weeks. Black bar, all participants (n = 37); blue bar, patients with HbA1c < 7.0% at 54 weeks (n = 7); red bar, patients with HbA1c ≥ 7.0% at 54 weeks (n = 30). Each value represents the mean ± standard error of the mean. *P < 0.05 by the Mann–Whitney U‐test. (f) Receiver operating characteristic (ROC) curves of CPI to predict the achievement of HbA1c < 7.0% at 54 weeks without adding additional antidiabetic drugs or bolus insulin. The area under the curve (AUC) is 0.752 (95% confidence interval 0.548–0.957). The estimated cut‐off point is 1.103 with 86% sensitivity and 67% specificity.
