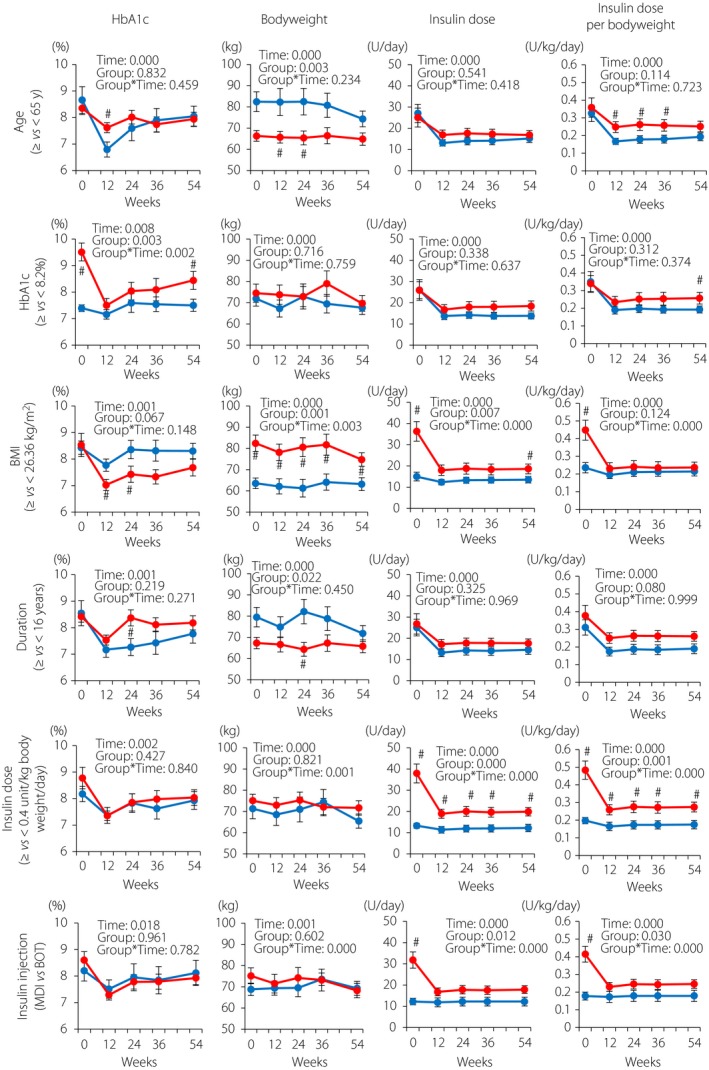
Figure 3.

Subgroup analysis of glycated hemoglobin (HbA1c) and bodyweight changes by baseline HbA1c, body mass index (BMI), estimated duration of type 2 diabetes, insulin dose per bodyweight and insulin injection types. The patients who continued liraglutide and basal insulin combination therapy for 54 weeks without taking additional anti‐oral diabetic drugs or bolus insulin were stratified by age (<65 or ≥65 years), baseline HbA1c (median 8.2%), baseline BMI (median 26.36 kg/m2), estimated duration of diabetes (median 16.0 years), total insulin dose (median 0.4 units/kg bodyweight/day) and insulin injection types (multiple dose insulin [MDI] or basal insulin‐supported oral therapy [BOT]). Blue, patients with aged <65 years (n = 16) or below the medians (HbA1c, n = 18; BMI, n = 18; duration of type 2 diabetes, n = 18; and total insulin doses, n = 18) or those with BOT (n = 11); red, patients aged ≥65 years (n = 21) or above the medians (HbA1c, n = 19; BMI, n = 19; duration of type 2 diabetes, n = 19; and total insulin doses, n = 19) or those with MDI (n = 26). Each value represents the mean ± standard error of the mean. Time‐course curves were analyzed by mixed‐effects models including group, time and the interaction of group and time, and the P‐values are shown. # P < 0.05 (vs patients with values below the medians or patients with BOT) by the Mann–Whitney U‐test.
