
Figure 2.
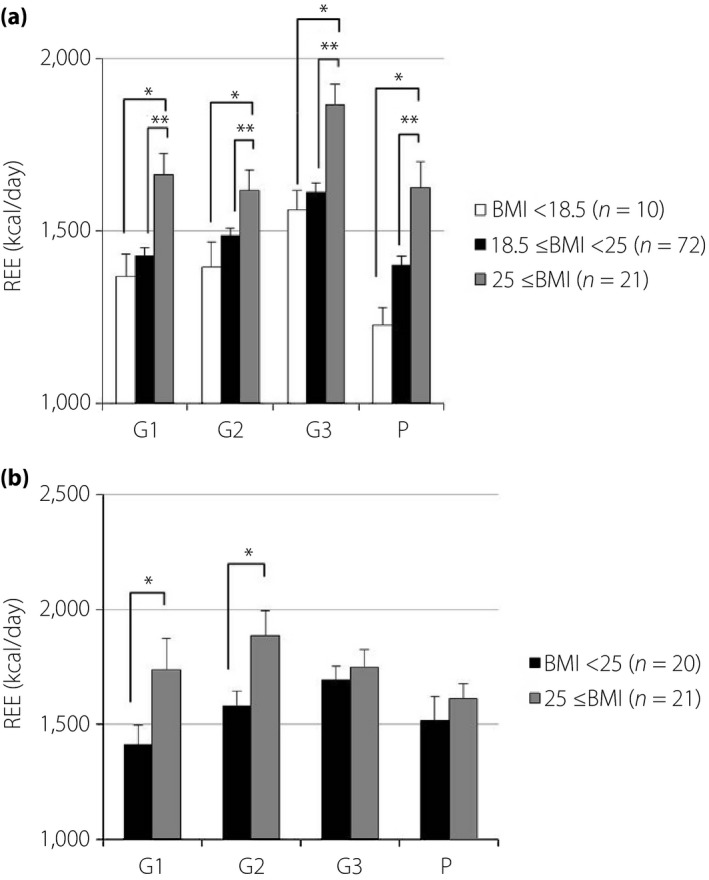
Associations between resting energy expenditure (REE) and prepregnancy body mass index (BMI; REE data are expressed as kilocalories per day. The height of each bar represents the mean ± standard error). (a) No diabetes. (b) Diabetes. *P < 0.05, **P < 0.01). G1, first trimester; G2, second trimester; G3, third trimester; P, postpartum.