Figure 7.
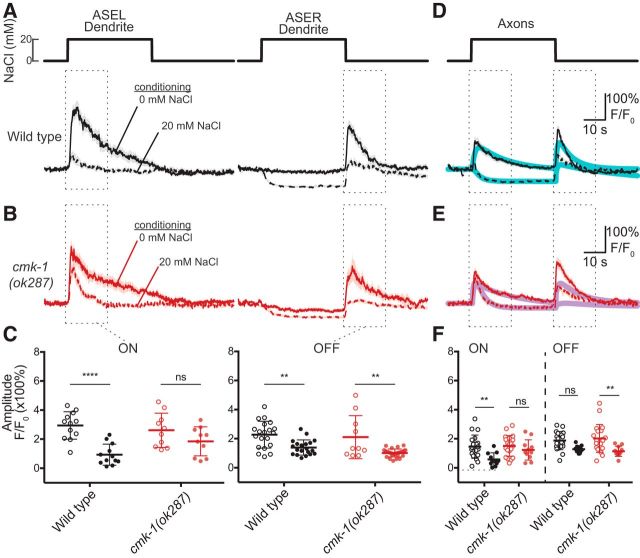
CMK-1 is required for the effect of salt conditioning on chemosensory calcium signals in dendrites and axons of ASE sensory neurons. A, Average chemosensory calcium signals recorded from ASEL (left) and ASER dendrites (right) in wild-type worms conditioned in 0 or 20 mm NaCl and no food and exposed to a 40 s pulse of 20 mm NaCl. Lines indicate the mean and light shading indicates ±SEM of at least 12 recordings. Figure 7-1A shows the individual replicates for ASEL (left) and ASER (right) dendrites. B, Average chemosensory calcium signals recorded from ASEL (left) and ASER dendrites (right) in cmk-1(ok287) worms conditioned in 0 or 20 mm NaCl and no food and exposed to a 40 s pulse of 20 mm NaCl. Lines indicate the mean and light shading indicates ±SEM of at least 10 recordings. Figure 7-1B shows the individual replicates for ASEL (left) and ASER (right) dendrites. C, Maximum amplitude of ON (left) and OFF (right) responses in dendrites of ASE neurons of wild-type and cmk-1(ok287) worms conditioned in 0 mm NaCl (open circles) or 20 mm NaCl (closed circles). Maximum amplitude was extracted from calcium traces by subtracting the average signal measured 10 s before the outlined region from the maximum signal in the region outlined by dotted line in the normalized fluorescence plots in A and B. For the ASEL dendrite, a two-way ANOVA revealed a significant interaction between genotype and condition (F(1,40) = 4.546, p = 0.0392). For the ASER dendrite, a two-way ANOVA failed to detect an interaction between genotype and condition (F(1,73) = 0.303, p = 0.5837). D, Average chemosensory calcium signals recorded from ASE axons in wild-type worms conditioned in 0 or 20 mm NaCl and no food and exposed to a 40 s pulse of 20 mm NaCl. Lines indicate the mean and light shading indicates ±SEM of at least 11 recordings. Figure 7-1A (right) shows the individual replicates of wild-type axon recordings. The solid cyan lines are a weighted average of the mean traces of the ASEL and ASER dendrites, which were fitted individually [dASEL(t), dASER(t), as described in Materials and Methods]. The weighting factor, dAxon(t) = A * dASEL(t) + (1 − A) * dASER(t), was estimated by minimizing the r2 of the difference between d Axon(t) and the mean fluorescence signal measured from the axon (black line). The weighting factors were 0.4 and 0.29 for 0 and 20 mm NaCl conditioned animals. E, Average chemosensory calcium signals in the axons of ASE neurons in cmk-1(ok287) worms conditioned in 0 or 20 mm NaCl and no food and exposed to a 40 s pulse of 20 mm NaCl. Lines indicate the mean and light shading indicates ±SEM of at least 11 recordings. Figure 7-1B (right) shows the individual replicates for cmk-1 mutant axon recordings. The solid magenta lines are a weighted average of fits to the mean traces of the ASEL and ASER dendrites [dASEL(t), dASER(t); as described in Materials and Methods]. The weighting factor, dAxon (t) = A * dASEL(t) + (1 − A) * dASER(t), was estimated by minimizing the r2 of the difference between dAxon (t) and the mean fluorescence signal measured from the axon. The weighting factors were 0.47 and 0.67 for 0 and 20 mm NaCl conditioned animals, respectively. F, Maximum amplitude of ON (left) and OFF (right) responses in the ASE axons recorded from wild-type and cmk-1(ok287) worms conditioned in 0 mm NaCl (open circles) or 20 mm NaCl (closed circles). Maximum amplitude was extracted from calcium traces by subtracting the average signal of 10 s before the outlined region from the maximum signal in the region outlined by dotted line in the normalized fluorescence plots in D and E. A two-way ANOVA failed to reveal an interaction between genotype and condition (F(3,116) = 1.203, p = 0.3119). Sidak's posthoc tests were used to assess the effect of conditioning and to compare genotypes in panels C and F. The results are indicated by asterisks: ** and **** denote p < 0.01 and p < 0.0001, respectively and ns denotes not significant.

