Figure 8.

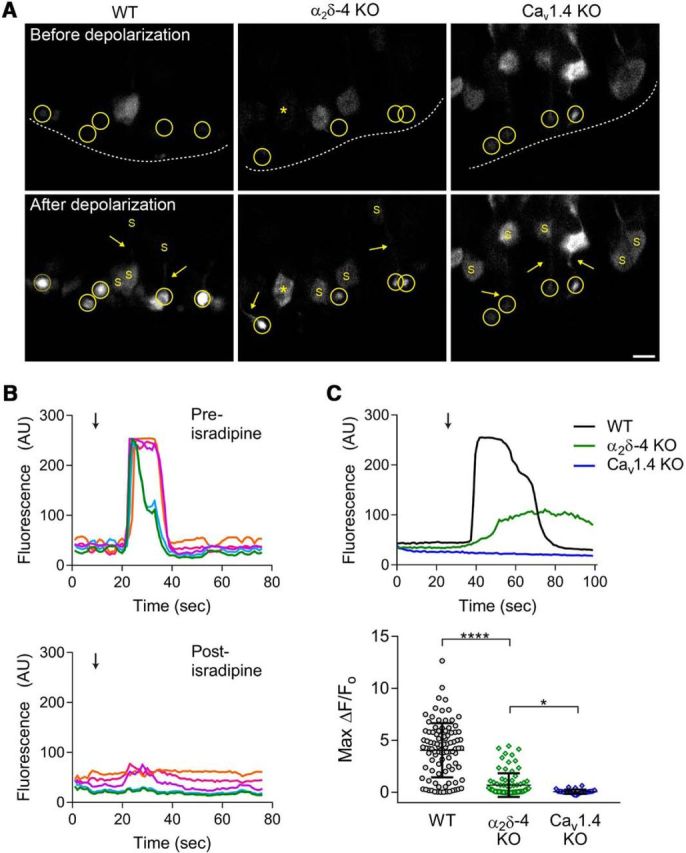
Presynaptic Ca2+ signals in rod spherules are diminished in α2δ-4 KO mice. A, Representative images of GCaMP6s signals in the retina of electroporated WT, α2δ-4 KO, and Cav1.4 KO mice before (top) and after (bottom) exposure to high K+-containing solution. Top, Dashed line indicates the boundary of the OPL. Rod terminals serving as ROIs (circled) were readily distinguished from rod soma (S). Rod axons (arrows) and occasionally soma (*) showed increases in K+-evoked signals (bottom). Scale bar, 5 μm. B, Representative traces from WT mice corresponding to GCaMP6s fluorescence following exposure to high K+. Arrow indicates initiation of 10 s perfusion with 40 mm K+ before (top) and after (bottom) 10 min perfusion with isradipine (2 μm). The color of the trace represents an individual ROI and is the same in the preisradipine and postisradipine traces. C, Top, Representative traces corresponding to changes in GCaMP6s fluorescence evoked as in B, but in WT, α2δ-4 KO, Cav1.4 KO mice. Bottom, Maximal change in GCaMP6s fluorescence (Max ΔF/Fo) in response to high K+ in synaptic terminals of WT, α2δ-4 KO, and Cav1.4 KO mice. Error bars indicate mean ± SD. Significant differences were determined by Kruskal–Wallis test with Dunnett's post hoc test. *p ≤ 0.05, ****p ≤ 0.0001.
