Figure 11.
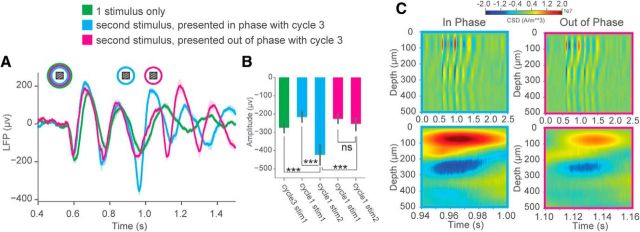
Ongoing θ oscillations influence incoming visually evoked responses. A, Averaged VEPs after training when a single familiar stimulus is presented (green trace) or when a second familiar stimulus is presented at a delay either in phase (cyan trace) or out of phase (magenta trace) with the third cycle of the oscillation. B, Average amplitude of the first cycle VEP for the first stimulus (Cycle1, stim1) presented or the second stimulus (Cycle1, stim2) when it is presented either in phase or out of phase with the third cycle of the oscillation. An additional comparison is made between the average amplitude at the third cycle elicited by the 1 stimulus control and the average amplitude of the first cycle for the second stimulus presented in phase or out of phase. Two-way ANOVA: Factor 1, visual stimulus condition (in phase familiar or out of phase familiar); Factor 2, oscillation cycle (cycle1 stim1 or cycle1 stim 2). There was a significant interaction between visual stimulus condition and oscillation cycle on VEP amplitude (F(1,68) = 20.5) (p < 0.0001). Tukey HSD multiple comparison of means, selected comparisons: IN_stim1_cycle1_familiar versus IN_stim2_cycle1_familiar, p < 0.0001. OUT_stim1_cycle1_familiar versus OUT_stim2_cycle1_familiar, p = 0.77 (not significant). IN_stim2_cycle1_familiar versus OUT_stim2_cycle1_familiar, p < 0.0001. Welch's two-sample t tests: CTRL_stim1_cycle1_familiar versus IN_stim2_cycle1_familiar, p = 1.20E-4. CTRL_stim1_cycle1_familiar versus OUT_stim2_cycle1_familiar, p = 0.355 (not significant) (N = 18 trial averaged VEPs for each condition across 6 mice). C, Representative CSD analysis of oscillatory activity when the second stimulus is presented in phase (Top, cyan) or out of phase (Bottom, magenta) with the third cycle of the oscillation. Each example is zoomed in to show the current sink and source corresponding to the timing when the second stimulus is presented. Error bars indicate SEM. ***p < 0.001.

