
Figure 8.
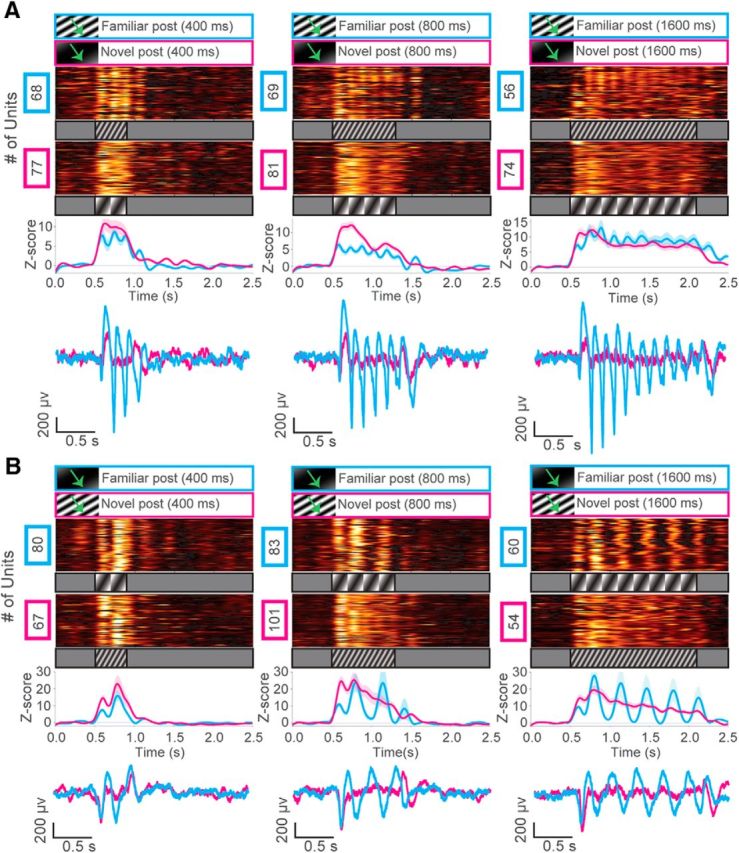
Oscillations extend with increasing durations of familiar visual stimuli. A, Top, z score of firing rate for all visually excited units from mice trained to a 200 ms drifting grating low SF (0.003 cpd) stimulus after training (cyan) at 400 ms, 800 ms, or 1600 ms durations (N = 2 mice). Unit oscillations extended across the entire duration of the stimulus but were not seen when a novel stimulus (magenta) with an intermediate SF (0.03 cpd) was presented. Line plots represent a population z score (baseline normalized) for each condition. Bottom, Representative VEPs at each stimulus duration for novel and familiar stimuli. B, z score of firing rate for all visually excited units from mice trained to a 200 ms drifting grating stimulus (SF = 0.03 cpd) after training (cyan) at 400 ms, 800 ms, or 1600 ms durations (N = 2 mice). Unit oscillations extended across the entire duration of the stimulus but were not seen when a novel stimulus (magenta) with a low SF (0.003 cpd) was presented. Line plots represent a population z score (baseline normalized) for each condition. Bottom, Representative VEPs at each stimulus duration for novel and familiar stimuli.