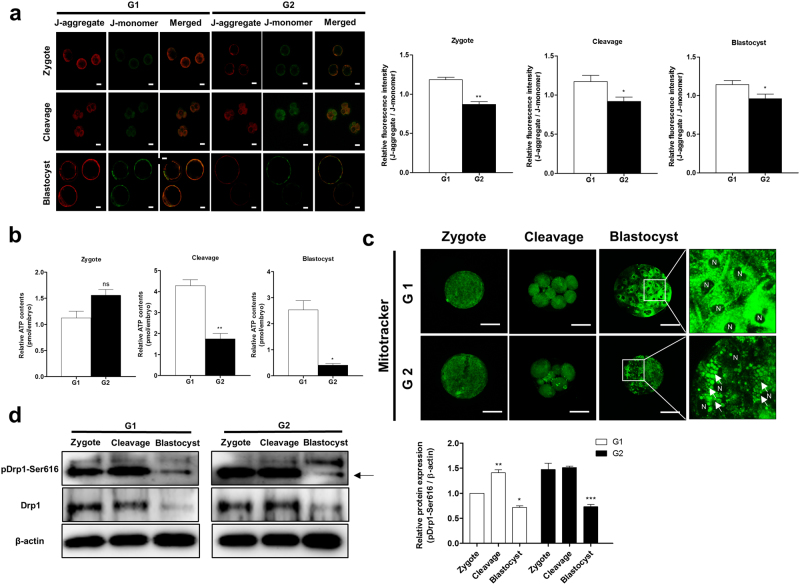
Figure 3.
Changes in mitochondrial function and dynamics in the G1 and G2 groups. (a) Expression of J-aggregate (red) and J-monomer (green) were determined by JC-1 using a confocal microscope. (b) ATP contents were measured by an ATP determination kit using a microplate reader. (c) Mitotracker (green) as the mitochondria-selective probe was measured under image system. N indicates the nucleus and arrows represent mitochondrial aggregation form. (d) Cropped blots are used in this figure, and the gels have been run under the same experimental conditions. Full-length blots are included for key data in the supplementary information. Western blot showing expression of mitochondrial fission proteins (Drp1 and phosphorylated Drp1-Ser616). Reactive protein levels were normalized to β-actin. Data in the bar graph represent means ± SEM from three independent experiments. To analyze these data, Dunnett’s multiple comparison test and t-test were used. Differences were considered significant at *p < 0.05 and ** < 0.01. Scale bar = 50 μm.

