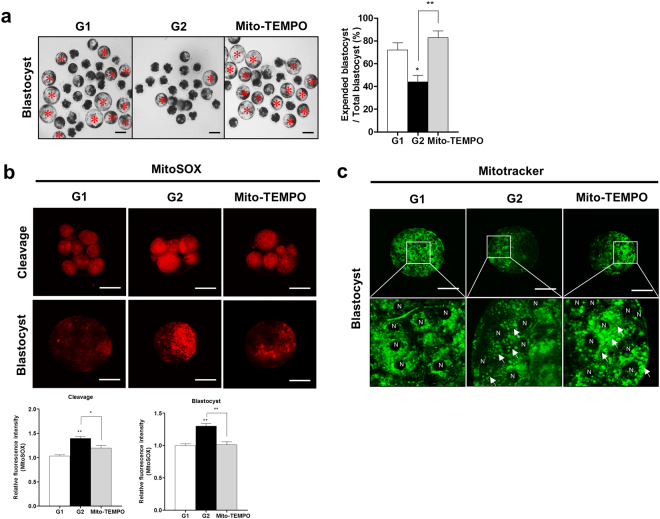
Figure 4.
Effects of Mito-TEMPO on early embryo development in porcine. (a) Red stars indicate the number of expanded blastocysts. Morphologies of blastocyst stage in G1, G2 and G2 with Mito-TEMPO treatment. Detection of (b) superoxide (red fluorescence) and (c) mitochondrial distribution (green fluorescence) in G2 zygotes treated with Mito-TEMPO during embryo development. The arrows show aggregation of mitochondria and N represents the nucleus. Data in the bar graph represent the means ± SEM from three independent experiments. To analyze these data, Tukey’s multiple comparison test was used. Differences were considered significant at *p < 0.05 and ** < 0.01. Scale bar = 50 μm.

