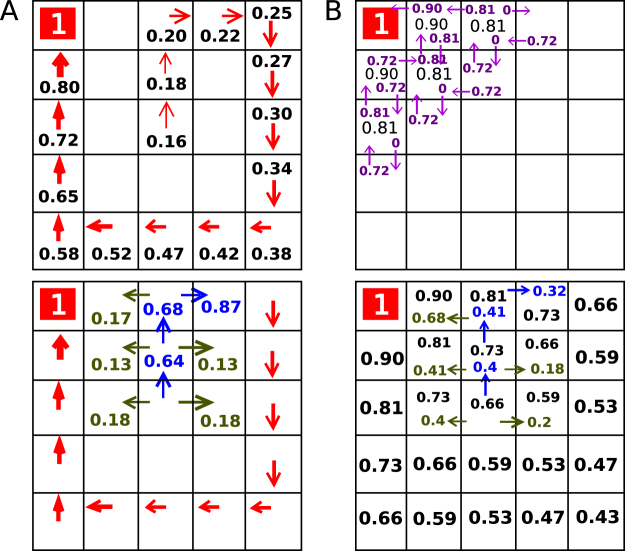
Figure 2.
Reinforcement learning models and model fits. The top panel displays action values, showing how valuable it is to move along the route in a certain state; the bottom panel shows the probability of taking certain actions in those state based on the action values. Black numbers are state values, blue numbers are probabilities of chosen action, green values refer to probabilities of other not chosen actions. Note that not all probabilities for non-preferred actions are shown. (A) Model free valuation based on the SARSA (λ) algorithm. After reaching a reward this algorithm updates the values only along the traversed path. (B) Model-based valuations derived from dynamic programming. The model-based algorithm updates values not only along the taken path, but across the entire grid world.

