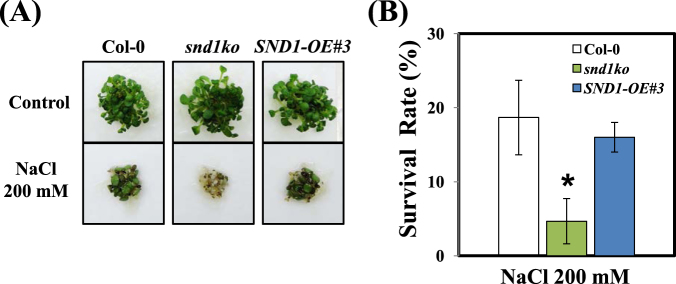
Figure 2.
Phenotype and survival rates of Col-0, snd1ko mutant, and SND1-overexpressing line under salinity stress. (A) The phenotype of Col-0, snd1ko mutant, and SND1-overexpressing line under salinity stress. The seeds were sown on filter paper placed on normal medium. After 2 d, the filter paper was transferred on medium supplemented with 200 mM NaCl. The figure shows seedlings 20 d after the transfer. (B) Survival was quantified by counting the green cotyledons of seedlings. The experiments included 40 seeds per sample and the error bars indicate the standard error (SE) from three replicates. The asterisks represent significant differences with respect to Col-0 (P < 0.05).

