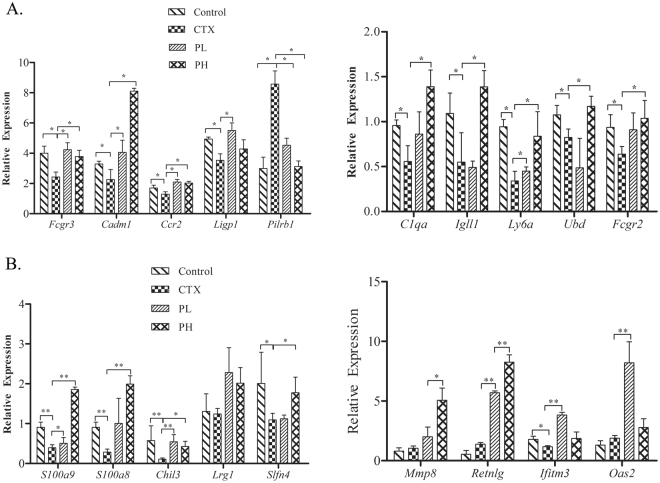
Figure 5.
qRT-PCR validation of DGE results of polysaccharides on the genes in T and B cells in immunosuppressed mice. (A) The expression of B cell genes. The figure shows that the polysaccharide formula could up-regulate Fcgr3, Cadm1, Ccr2, Ligp1, C1qa, IgllI, Ly6a, Ubd and Fcgr2 in B cells, consistent with the results of DGE. (B) The expression of T cell genes. The figure shows that t the polysaccharide formula could up-regulate S100a9, S100a8, Chil3, Slfn4, and Ifim3 in T cells, consistent with the results of DGE. (*p < 0.05, **p < 0.01).

