
Figure 3.
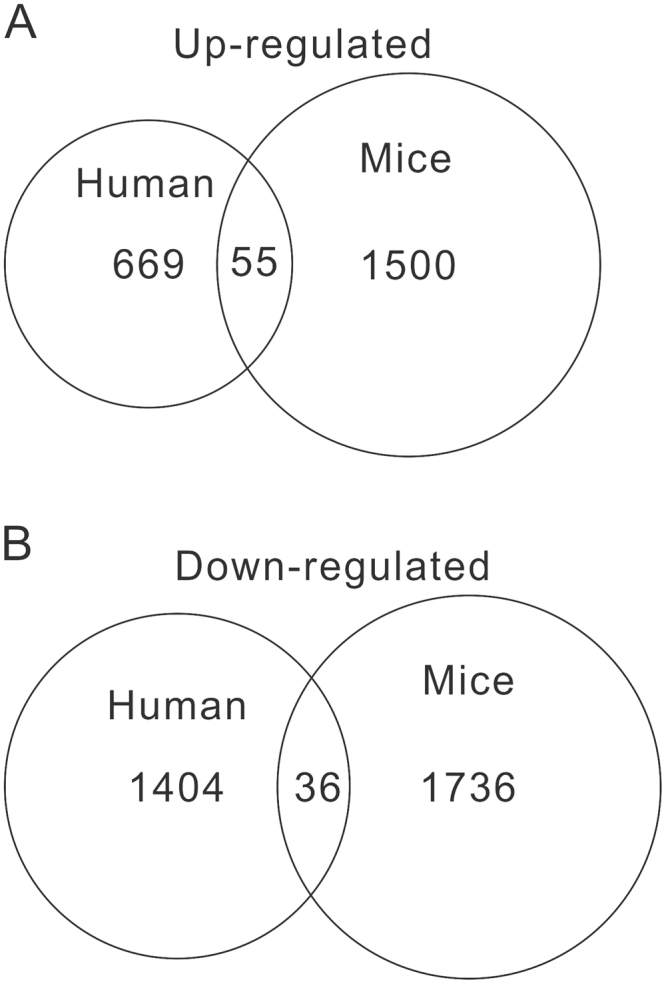
Venn-analysis of DEGs. (A) Overlap of up-regulated DEGs (human PPD VS control, mouse IS VS control). (B) Overlap of down-regulated DEGs (human PPD VS control, mouse IS VS control).
Official websites use .gov
A
.gov website belongs to an official
government organization in the United States.
Secure .gov websites use HTTPS
A lock (
) or https:// means you've safely
connected to the .gov website. Share sensitive
information only on official, secure websites.
Venn-analysis of DEGs. (A) Overlap of up-regulated DEGs (human PPD VS control, mouse IS VS control). (B) Overlap of down-regulated DEGs (human PPD VS control, mouse IS VS control).