Figure 2.
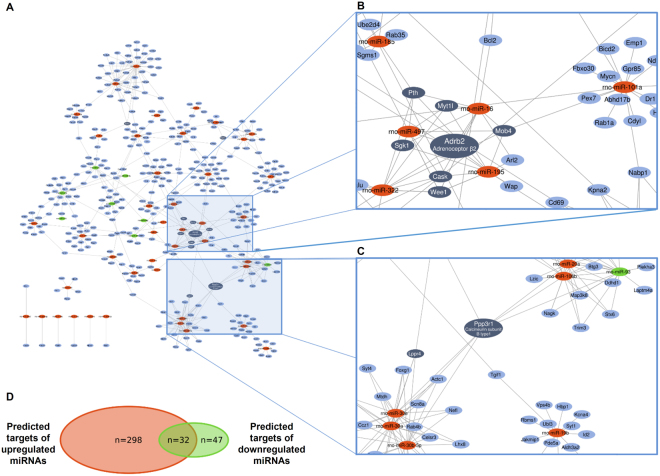
Interaction network and miRNA target prediction analysis of down- and upregulated miRNAs (A) showing the central role of Adrb2, Cask (B) and Ppp3r1 (C) mRNAs. High-resolution network is available as an online Supplementary material (Supplementary Fig. 1). Downregulated, upregulated miRNAs and mRNAs are indicated in green, red and blue, respectively. Dark blue represents mRNAs with at least 4 target interactions. Venn diagram presenting the number of predicted up- and downregulated miRNA targets (D).

