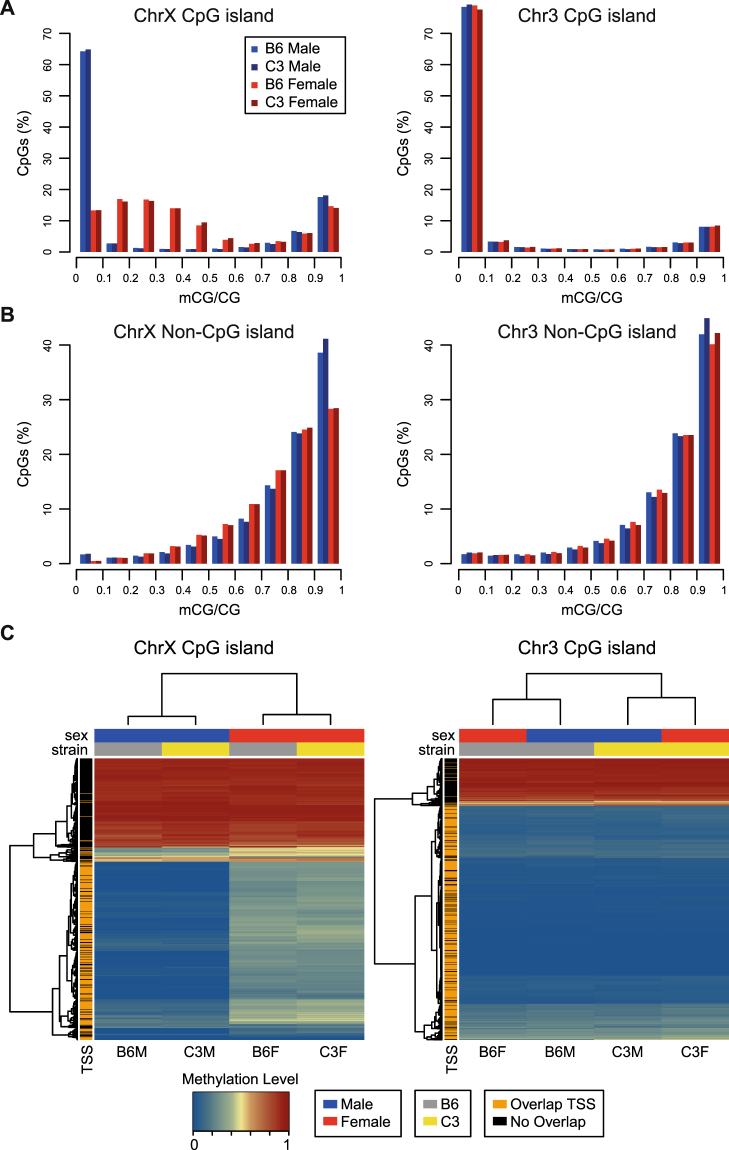
Figure 3.
Sexual dimorphisms at low methylation levels (0–50%) on the X chromosome largely reflect differences at promoter-proximal CpG islands. (A) Histogram plots representing frequency distributions of methylation level (mCG/CG) across only CpG sites located in CpG islands on chromosomes X and 3, with read depth of at least 10x. Number of CpGs included on the X chromosome: B6 Female, 44,430; B6 Male, 42,534; C3 Female, 40,345; C3 Male, 44,405. Number of CpGs included on chromosome 3: B6 Female, 67,135; B6 Male, 61,067; C3 Female, 59,010; C3 Male, 63,935. (B) Histogram plots representing frequency distributions of methylation level (mCG/CG) across only CpG sites located outside CpG islands on chromosomes X and 3, with read depth of at least 10x. Number of CpGs included on the X chromosome: B6 Female, 742,621; B6 Male, 750,468; C3 Female, 732,712; C3 Male, 742,753. Number of CpGs included on chromosome 3: B6 Female, 987,990; B6 Male, 987,968; C3 Female, 955,501; C3 Male, 955,242. (C) Heatmaps of methylation levels for CpG island regions on chromosomes X and 3. Rows represent CpG islands containing at least a minimum number of validated CpG sites (calculated as (length/16)*0.65) and with an average minimum read depth of at least 10x across all samples (n = 596 for chromosome X and n = 740 for chromosome 3). The methylation scale indicates the weighted methylation level of each island: blue, unmethylated; yellow, intermediate; red, methylated. Columns represent animal groups. Row and column dendrograms depict unsupervised clustering based on row or column means, using Euclidian distance with complete linkage clustering. Row sidebar indicates whether or not each CpG island overlaps a TSS. Column sidebars indicate sex and strain. ChrX, chromosome X; Chr3, chromosome 3.

