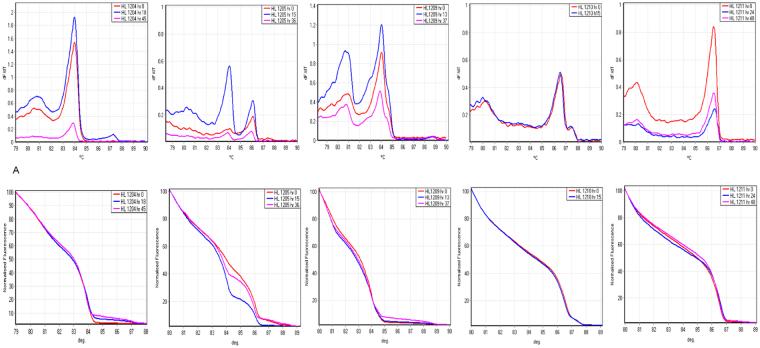
Figure 4.
msp1 HRM analysis of paired clinical samples from the same individuals. Melting amplification curves (top graphs) and normalized temperature-shifted HRM amplification curves (bottom graphs) of msp1 genotypes in 5 patients sampled before (hr 0) and after treatment (hr 13–48). Differences in raw florescence signal between timepoints were observed, but didn’t affect HRM genotype calls after normalization. dF/dT, negative derivative of change in florescence and C°, temperature.

