Fig. 7.
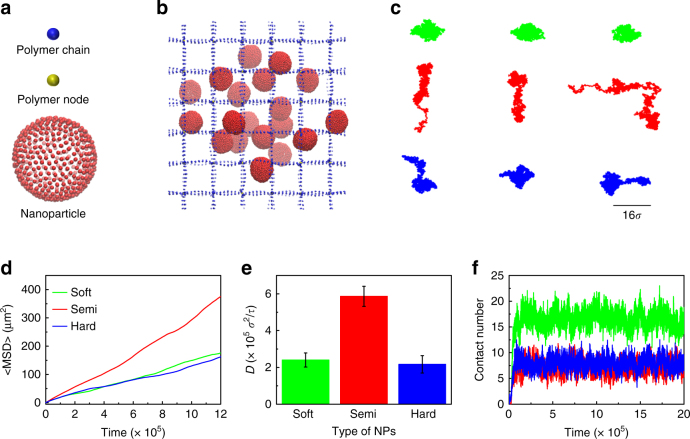
Snapshots and trajectories of NPs in mucus fibers. a The original construction of NP. b A snapshot of the polymer network (blue and yellow) and NPs during the simulation. c Typical centroid trajectories of NPs in simulations. d The representative MSD values of the three types of NP in a polymer network with a mesh size of 16σ. e The diffusivities of NPs in the polymer network. Data are shown as the means ± standard deviations (SDs). (n = 3). f The number of beads in each NP that came into contact with the polymer network. The blue, red, and green labels represent hard, semi-elastic, and soft NPs, respectively

