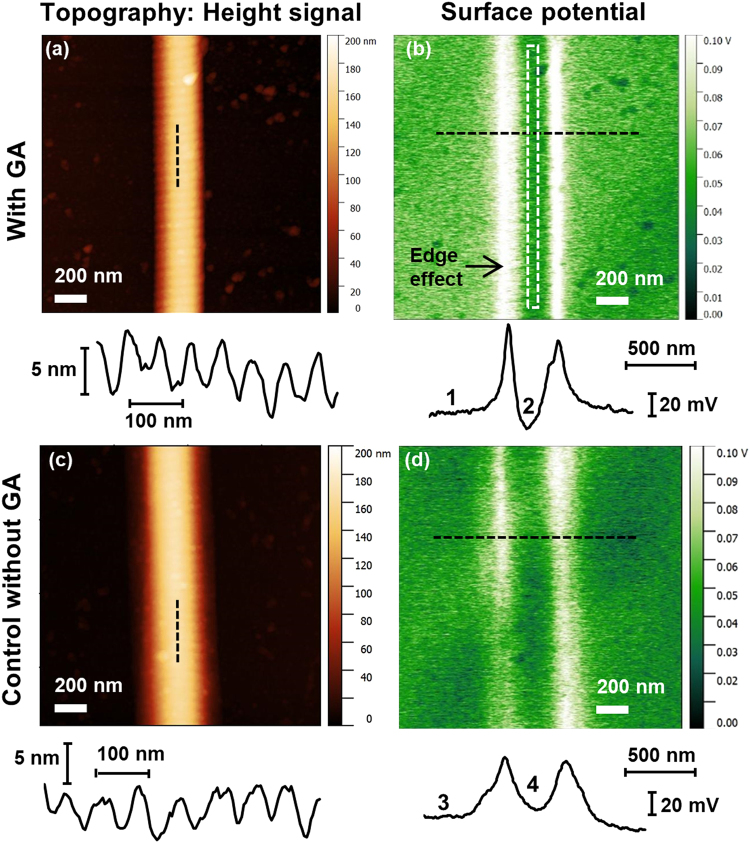
Figure 2.
Representative AFM/KFM images of collagen fibrils. Topography (a and c) and surface potential (b and d) of randomly selected collagen fibrils on glass. Top row (a and b) sample exposed to GA-solution; bottom row (c and d) sample exposed to control solution without GA. Images taken >48 h after removal of the sample from the solutions and drying in ambient conditions (ca. 40–50% relative humidity). Below the images: Longitudinal topography profiles as indicated in the images (a and c), cross-sectional potential profiles as indicated in the images (b and d). The white, dashed rectangle in (b) shows an example of the approximate area which was used for determining the fibril potential in the image analysis avoiding the “edge effect”.

