Figure 3.
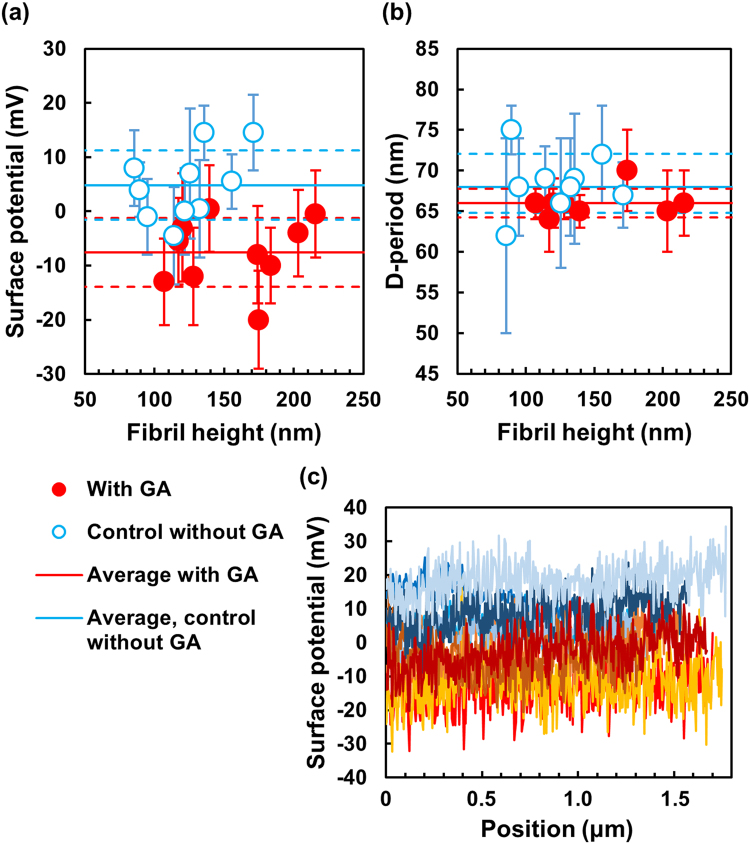
Effect of GA on surface potential and D-banding pattern of collagen fibrils. (a) Potential vs height of N = 10 randomly selected, individual fibrils for each sample, each data point represents one fibril with the potential determined over a length of at least 1.5 μm; (b) D-period vs height of the same fibrils as in (a), D-period determined as average over 10 bands per fibril, some fibrils had to be omitted as the banding-pattern was not pronounced enough in the AFM height images; red, full circles = sample exposed to GA; blue, open circles = control sample without GA; the horizontal error bars for the fibril heights are not shown as they are smaller (<10 nm) than the data symbols here;. Continuous, horizontal lines = average potential (a) and average D-period (b) of the data points for each sample; dashed, horizontal lines = upper and lower limit of the standard deviation of the data points. (c) Longitudinal potential profiles of 5 randomly chosen fibrils of each sample; profiles in shades of red/orange represent GA-exposed fibrils; profiles in shades of blue represent fibrils from the control sample. Note: The zero-potential is arbitrary; the vertical axes represent fibril potential minus glass potential.

