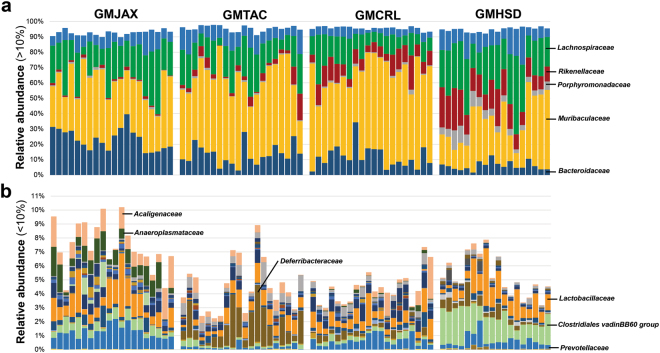
Figure 4.
Ninth generation CD1 mice differ in GM composition in accordance with producer origin of embryo transfer surrogates. Representative samples for ninth generation 6 to 8 week-old CD1 female mice (n = 18–20 per GM profile). (a) Bar charts of relative abundance of taxa at family level with a group mean relative abundance representing greater than 10%. (b) Bar charts of relative abundance of taxa at family level with a group mean relative abundance representing less than 10%. Statistical significance determined using one-way ANOVA or Kruskal–Wallis, depending on normality of data as determined via Shapiro-Wilk normality testing, and Benjamini-Hochberg correction for multiple testing (p ≤ 0.05 statistically significant). Statistically significant families noted by taxonomic name on bar chart.

