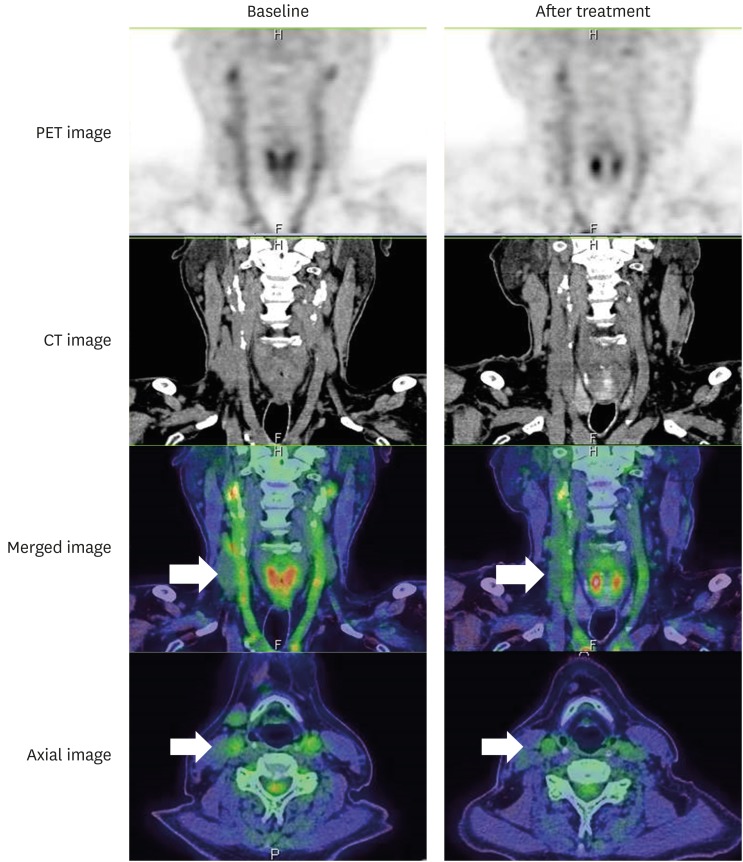
Figure 2.
Representative images of carotid plaque of a patient treated with atorvastatin and pioglitazone. Representative FDG-PET (top), CT (second from top), FDG-PET/CT (third from top) images at baseline (left) and at 3-month follow-up (right) are shown. Average of cross-sectional analysis (bottom) of FDG uptakes of the index vessel (arrow) was the primary endpoint.
CT = computed tomography; FDG = fluorodeoxyglucose; FDG-PET = fluorodeoxyglucose positron emission tomography.

