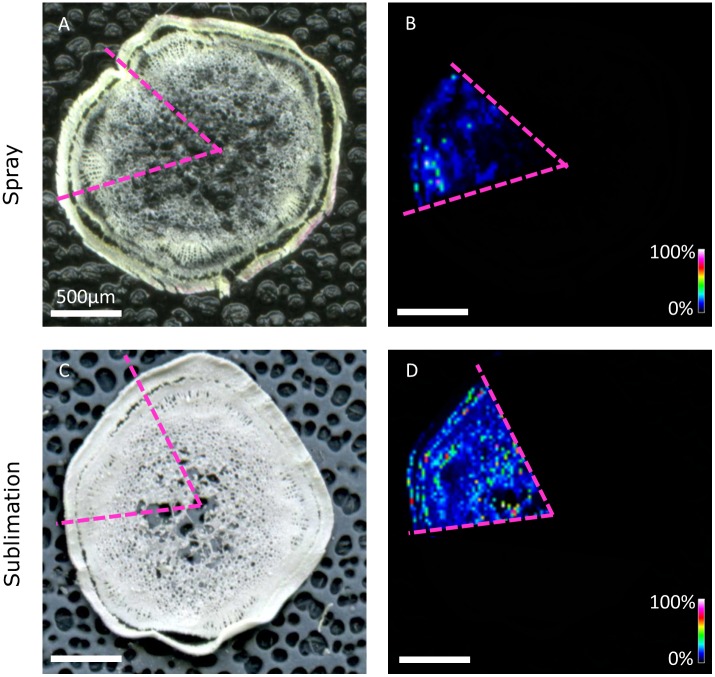
FIGURE 3.
Distribution of linamarin ([M+K]+ m/z 286.06873) in 40 μm sections of a M. esculenta stem excised approximately 5 cm from the apex and covered with 2,5-dihydroxybenzoic acid (DHB) either by TM spray (A,B) and sublimation (C,D). Data was not normalized, Scale represents 0–100% signal intensity. Bar: 500 μm.

