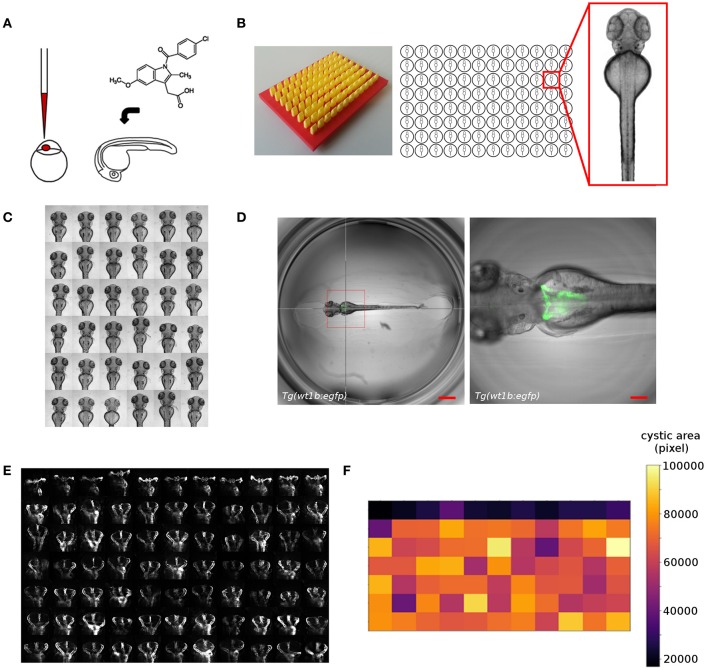
Figure 2.
Overview of screening workflows for organ specific phenotypic screening in zebrafish. Shown are examples from our screening work that illustrate the automatic acquisition of higher resolution datasets of embryonic kidneys in zebrafish embryos. (A) Experimental manipulation of embryos prior to mounting and automated imaging such as microinjection or compound treatment. (B) Mounting of zebrafish embryos in agarose coated microtiter plates generated using 3D printed orientation tools. Agarose layers contain cavities allowing for consistent alignment and orientation of specimen. (C) Automated acquisition of standardized views (e.g., dorsal) of zebrafish embryos arrayed in microtiter plates. (D) Automated acquisition of multidimensional image datasets using smart imaging techniques. Pronephric areas of the Tg(wt1b:egfp) zebrafish transgenic line are detected in low resolution datasets using image processing tools and are subsequently imaged at higher resolution. The hair cross indicates the detected position and the bounding box the field of view in subsequent higher resolution imaging. Scale bars indicate 600 μm (left panel) or 150 μm (right panel). (E) Detailed visualization of kidney regions enabling scoring of kidney phenotypes. Shown are wildtype (first row) or cystic (other rows) kidneys of 72 hpf Tg(wt1b:egfp) embryos. (F) Automated quantitative analysis and phenotypic scoring using image processing techniques. Heatmap shows quantitative measurements of cystic areas as shown in (E). Figure panels are taken or modified from Westhoff et al. (93), Wittbrodt et al. (125), Pandey et al. (unpublished), and www.acquifer.de.

