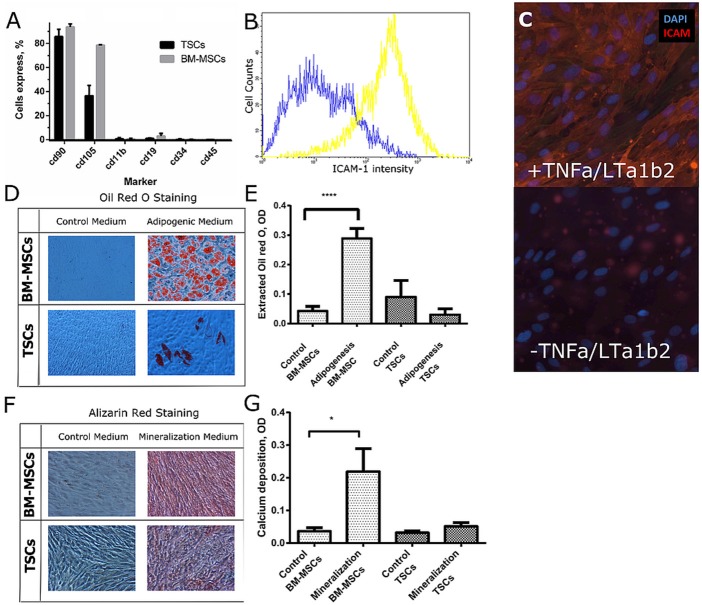
Figure 1.
Characterization of TSCs in comparison with BM-MSCs. (A) BM-MSCs and TSCs were screened on a panel of mesenchymal markers. (B,C) TSCs were cultured with and without TNF-α and LT-α1β2 for 48 h. ICAM-1 expression was assessed by FACS analysis (B), and by immunofluorescent staining (C). (D) BM-MSCs and TSCs were cultured in adipogenic medium for 3 weeks; lipids were stained with oil red O. (E) Lipid quantification was performed by lysis of stained lipids with Oil red O in a mixture of isopropanol and Igepal. (F) BM-MSCs and TSCs were cultured in osteogenic medium for 4 weeks; deposited calcium was stained with Alizarin red. (G) Calcium deposition was quantified using a calcium assay kit. *Indicates significant difference with a p < 0.05. ****Indicates significant difference with a p < 0.0001.

