Figure 4.
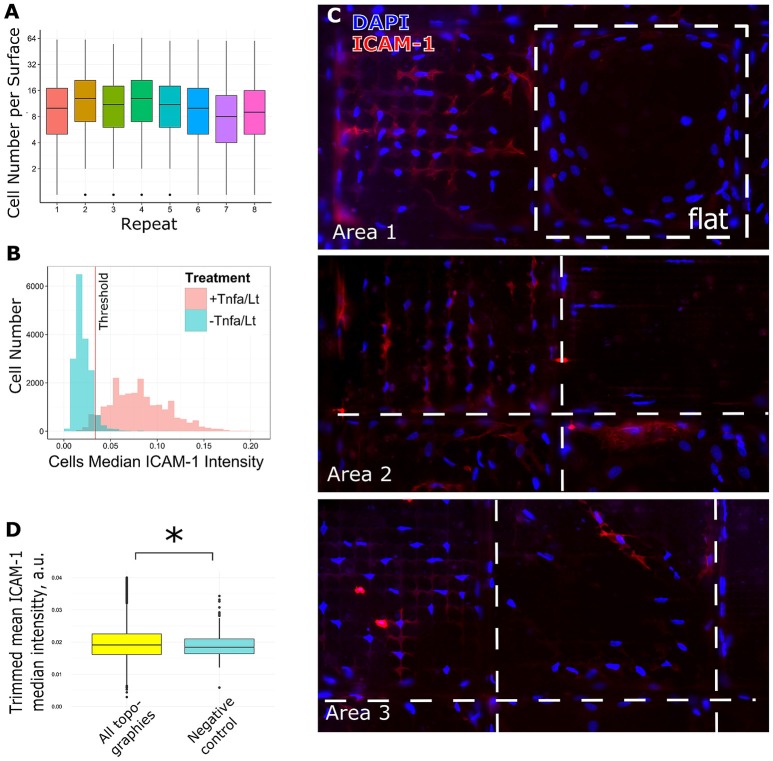
Analysis of screening data and selection of hits. TSCs cells were cultured on 8 Topochips in basic media for 48 h. (A) Distribution of cell number per TopoUnit among all replicas. Cell numbers were counted by DAPI staining. (B) TSCs cells were cultured with or without TNF-α and LT-α1β2 on flat polystyrene for 48 h. The difference in ICAM-1 expression in samples treated and untreated with TNF-α and LT-α1β2., positive and negative control correspondingly. The threshold for identification of ICAM-1 positive vs. negative cells is shown as a red line. (C) The difference in ICAM-1 expression in cells, shown on random areas of the Topochip. DNA (blue) was stained with DAPI, ICAM-1 (red) was stained using an antibody against ICAM-1. Dashed white line shows borders between different topographies. (D) Median expression of ICAM-1 in cells on topographies was higher than in negative control and significantly different with a p-value less than 0.01 using a Wilcoxon rank sum test. *indicates significant difference with a p-value < 0.01.

