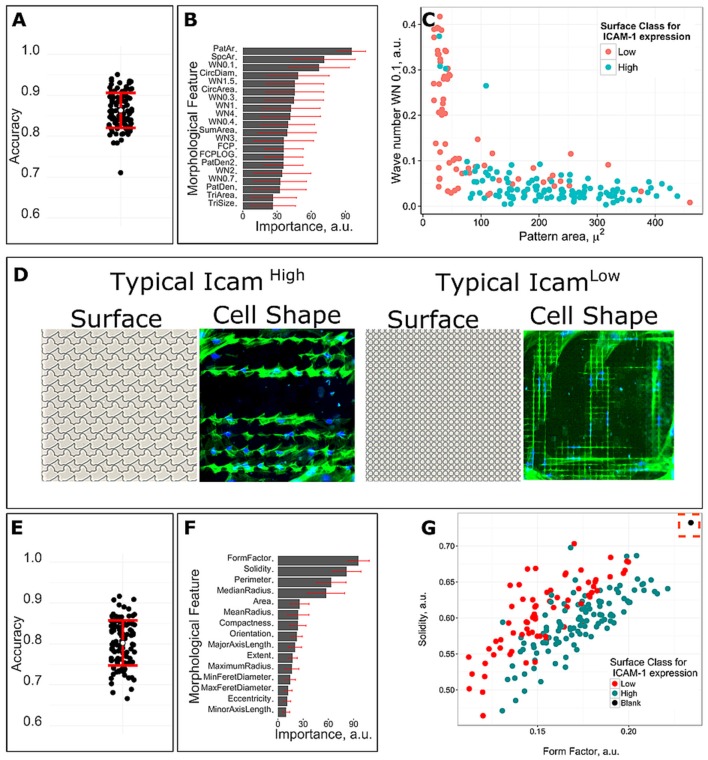
Figure 6.
Correlations between surface design, cell shape and ICAM-1 expression. A machine learning model was trained with 10 fold cross-validation by employing random forest classification algorithm. Seventy-two low scoring units and one hundred twelve high-scoring units with significantly different frequency of ICAM-1 positive cells were used for the analysis. (A) The accuracy of 100 predicted models based on surface design parameters. (B) Feature mean and standard deviation of importance for predicting surface class for ICAM-1 level based on surface design parameters. (C) Surfaces with different level of ICAM-1 can be distinguished based on surfaces design parameters that were predicted as the most important by the model. (D) Typical cell morphologies and topography structure of ICAM-1Low and ICAM-1High surfaces. Green corresponds to actin and blue for nuclei. (E) The accuracy of 100 predicted models based on cell shape parameters. (F) Feature mean and standard deviation of cell shape parameters importance for predicting surface class for ICAM-1 level. (G) Surfaces with the different level of ICAM-1 can be distinguished based on cell shape parameters that were predicted as the most important by the model. Black dot is a control, cells on flat surfaces.

