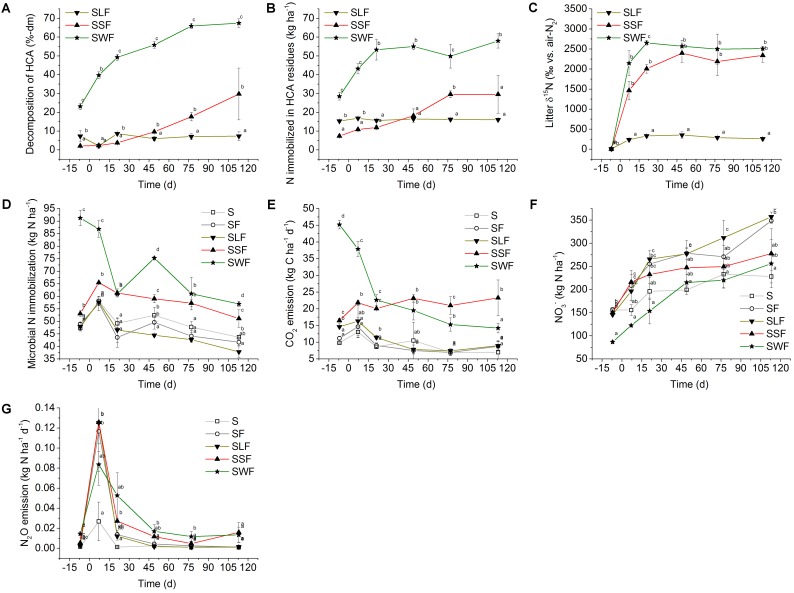
FIGURE 2.
(A) HCA decomposition (% loss of initially applied HCA dry matter), (B) physical and/or chemical N immobilization by the remaining HCA residues in kg N ha-1 and (C) δ15N values in ‰ vs. air-N2 in soil treated with mineral N and lignin (SLF, solid triangle downward), spruce sawdust (SSF, solid triangle upward), and wheat straw (SWF, solid star symbol). (D) Microbial N immobilization (kg N ha-1), (E) CO2 emission 24 h before soil sampling in kg C ha-1 d-1, (F) NO3- concentration in kg N ha-1, and (G) N2O emission in kg N ha-1 d-1 in soil of the control treatment (S, open square) without any fertilizer or HCA, the fertilizer control treatment (SF, open circle) with mineral N fertilizer, and the HCA treatments with mineral N fertilizer plus lignin (SLF, solid triangle downward), spruce sawdust (SSF, solid triangle upward), or wheat straw (SWF, solid star symbol). Incubation time d = 0 divides the experiment into a period before (–7 DBF) and after (7, 21, 49, 77, and 113 DAF) mineral N fertilization. Standard deviations of mean values (n = 3) are displayed. Statistically significant differences between treatments at a certain incubation time are depicted by different lowercase letters next to the symbols (p < 0.05).

