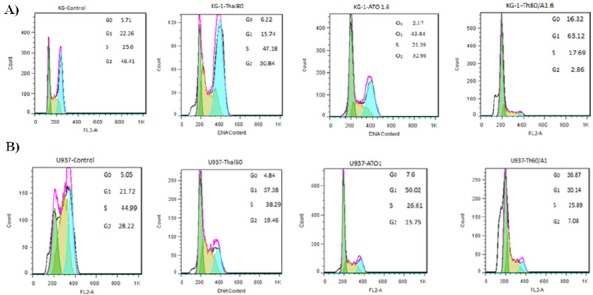
Figure 7.

Cell Cycle Flow Cytometry Analysis of Leukemia Cells. 48h exposure to different concentrations of ATO and THAL reduces the number of cells at G2 phase and increases the amount of cells at G1 phase of the cell cycle in KG-1, and U937 cells and was observed significant accumulation of cells in theG0/G1 phase.. Statistical significance were defined at * p <0.05, ** p <0.01 and *** p <0.001 compared to corresponding control.
